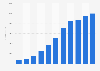
This statistic displays the increase in spending in mobile oriented shops in Great Britain (GB) in 2015. During the survey period, it was found that 27.1 percent of responding customers stated that they would increase their spending by 15 percent.
Will you spend more in these outlets* in 2015?
Basic Account
Get to know the platform
You only have access to basic statistics.
This statistic is not included in your account.
Starter Account
The ideal entry-level account for individual users
- Instant access to 1m statistics
- Download in XLS, PDF & PNG format
- Detailed references
$199 USD / Month *
Professional Account
Full access
Business Solutions including all features.
* Prices do not include sales tax.
Other statistics that may interest you Statistics on
About the industry
10
- Premium Statistic Mobile browser market share in Hong Kong 2018-2023
- Premium Statistic Monthly market share of Safari in mobile browsers in Taiwan 2018-2024
- Premium Statistic Monthly market share of Samsung Internet in mobile browsers in Hong Kong 2018-2024
- Premium Statistic Monthly market share of Chrome in mobile browsers in Taiwan 2018-2024
- Basic Statistic Monthly market share of Chrome in mobile browsers in Hong Kong 2018-2024
- Basic Statistic Monthly market share of Safari in mobile browsers in Hong Kong 2018-2024
- Premium Statistic Monthly market share of Samsung Internet in mobile browsers in Taiwan 2018-2024
- Premium Statistic Monthly market share of Opera in mobile browsers in Taiwan 2018-2024
- Premium Statistic Mobile browser market share in Taiwan 2024
- Premium Statistic Type of mobile phone owned by adults in the United States 2019
About the region
10
- Basic Statistic Options most desired by consumers for mobile-orientated retail facilities in GB 2015
- Premium Statistic Coronavirus impact on gaming app downloads in Western Europe in Q1 2020
- Basic Statistic Online audience distribution of expertreviews.co.uk in GB 2020, by age group
- Basic Statistic GB: online audience distribution of expertreviews.co.uk 2020, by age group and gender
- Basic Statistic GB: online audience distribution of expertreviews.co.uk 2020, by household income
- Basic Statistic GB: web audience distribution of expertreviews.co.uk 2020, by educational attainment
- Premium Statistic Accessing the internet "on the go" in Great Britain in 2019, by demographic
- Basic Statistic Out of home internet access in Great Britain 2013-2019, by portable device
- Premium Statistic Catch-up TV viewing penetration in Great Britain 2013-2019, by device
- Basic Statistic Penetration rate of Apple iPhone in Great Britain from Q1 2011-Q3 2018
Selected statistics
2
Other regions
10
- Premium Statistic Number of smartphones sold in China 2012
- Premium Statistic Online banking emerging practices in France 2018
- Premium Statistic Smartphone users as share of mobile phone users in the Philippines 2014-2020
- Premium Statistic Survey on ways to transfer money mobile in Finland 2016
- Premium Statistic Telephone types used by children in Poland 2022
- Premium Statistic Market share of smartphone manufacturers in the United Kingdom (UK) 2019
- Premium Statistic Smartphone ownership in the U.S. 2011-2023, by gender
- Premium Statistic Mobile phone ownership distribution South Korea 2022, by device type
- Basic Statistic Smartphone users in Canada 2018-2024
- Basic Statistic Mobile phone subscribers in Egypt 2013-2019
Related statistics
10
- Basic Statistic Share of French ready to use artificial intelligence for banking 2018
- Premium Statistic Mobile phone ownership among children in Sweden 2018, by age group
- Premium Statistic U.S. teen frequency of smartphone notification activities 2018
- Premium Statistic Users in France downloading mobile apps 2012-2022, by gender
- Premium Statistic France: messaging app usage 2018-2022, by age
- Basic Statistic Canada leading mobile internet activities 2022
- Premium Statistic Average time spent online on mobile/smartphone weekly in Denmark 2020, by age
- Basic Statistic Uploading visual content from mobile phones by children in Sweden 2020, by age
- Basic Statistic Listening to music from mobile phones by children in Sweden 2020, by age
- Basic Statistic Calls on mobile phones by children in Sweden 2020, by age
Further related statistics
10
- Smartphone share of handset unit sales in the United Kingdom (UK) 2010-2013
- Number of China Unicom mobile subscriptions 2012-2022
- Podcast consumption on mobile in the U.S. 2017
- Survey: ownership of mobile devices by U.S. American adults 2011-2012
- BlackBerry net income/loss 2009-2023
- China Mobile's total assets 2012-2022
- China Mobile's EBITDA 2012-2022
- Device usage among children to consume media in the United Kingdom (UK) 2013-2019
- Apple iPhone sales worldwide 2007-2022
- Smartphone adoption in the United Kingdom (UK) 2011-2018
Further Content: You might find this interesting as well
Statistics
- Smartphone share of handset unit sales in the United Kingdom (UK) 2010-2013
- Number of China Unicom mobile subscriptions 2012-2022
- Podcast consumption on mobile in the U.S. 2017
- Survey: ownership of mobile devices by U.S. American adults 2011-2012
- BlackBerry net income/loss 2009-2023
- China Mobile's total assets 2012-2022
- China Mobile's EBITDA 2012-2022
- Device usage among children to consume media in the United Kingdom (UK) 2013-2019
- Apple iPhone sales worldwide 2007-2022
- Smartphone adoption in the United Kingdom (UK) 2011-2018
VoucherCodes.co.uk, & Centre for Retail Research. (April 13, 2015). Will you spend more in these outlets* in 2015? [Graph]. In Statista. Retrieved April 27, 2024, from https://www.statista.com/statistics/487713/gb-increase-in-spending-in-mobile-oriented-stores/
VoucherCodes.co.uk, und Centre for Retail Research. "Will you spend more in these outlets* in 2015?." Chart. April 13, 2015. Statista. Accessed April 27, 2024. https://www.statista.com/statistics/487713/gb-increase-in-spending-in-mobile-oriented-stores/
VoucherCodes.co.uk, Centre for Retail Research. (2015). Will you spend more in these outlets* in 2015?. Statista. Statista Inc.. Accessed: April 27, 2024. https://www.statista.com/statistics/487713/gb-increase-in-spending-in-mobile-oriented-stores/
VoucherCodes.co.uk, and Centre for Retail Research. "Will You Spend More in These Outlets* in 2015?." Statista, Statista Inc., 13 Apr 2015, https://www.statista.com/statistics/487713/gb-increase-in-spending-in-mobile-oriented-stores/
VoucherCodes.co.uk & Centre for Retail Research, Will you spend more in these outlets* in 2015? Statista, https://www.statista.com/statistics/487713/gb-increase-in-spending-in-mobile-oriented-stores/ (last visited April 27, 2024)
Will you spend more in these outlets* in 2015? [Graph], VoucherCodes.co.uk, & Centre for Retail Research, April 13, 2015. [Online]. Available: https://www.statista.com/statistics/487713/gb-increase-in-spending-in-mobile-oriented-stores/