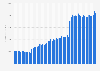
- Technology & Telecommunications›
- Telecommunications›
Number of mobile subscribers of HT 2013-2020
Industry-specific and extensively researched technical data (partially from exclusive partnerships).
A paid subscription is required for full access.
Number of mobile subscribers of HT 2013-2020
Number of mobile subscribers of Hutchison Telecom in Hong Kong from 2013 to 2020 (in thousands)

Number of mobile subscribers of Hutchison Telecom in Hong Kong from 2013 to 2020 (in thousands)
Number of subscribers in thousands | |
---|---|
- | - |
- | - |
- | - |
- | - |
- | - |
- | - |
- | - |
- | - |
Number of subscribers in thousands | |
---|---|
- | - |
- | - |
- | - |
- | - |
- | - |
- | - |
- | - |
- | - |
You need a Premium Account for unlimited access.
Full access to 1m statistics
Incl. source references
Available to download in PNG, PDF, XLS format
You need a Premium Account for unlimited access.
Full access to 1m statistics
Incl. source references
Available to download in PNG, PDF, XLS format
© Statista 2019
About this statistic
Show source
Please be patient - this may take a moment
Description
Source
More information
- Show sources information
- Show publisher information
- Release date
- June 2018
- Region
- Asia, Hong Kong
- Survey time period
- 2013 to 2017
- Supplementary notes
- * Forecasted.
Source
- Show sources information
- Show publisher information
- Release date
- June 2018
More information
- Region
- Asia, Hong Kong
- Survey time period
- 2013 to 2017
- Supplementary notes
- * Forecasted.
Other statistics on the topic
You only have access to basic statistics.
This statistic is not included in your account!
- Instant access to 1m statistics
- Download in XLS, PDF & PNG format
- Detailed references
$59 / Month *
Corporate solution including all features.
Prices do not include sales tax.


Statista has been my savior on several occasions. The site is easy to maneuver and the data is in a format that can go right into a report or presentation.Marlene Greenfield
Vice President, Hearst Magazines
- Overview
- Turnover of the telecommunications industry in Finland from 2010 to 2017, by sector (in million euros)Turnover of the telecommunications industry in Finland 2010-2017, by sector
- Market share of telecommunication providers in Finland in 2017Market share of telecommunication providers in Finland 2017
- Market share of mobile broadband internet service providers in Finland from 2007 to 2017Mobile internet service provider market share in Finland 2007-2017
- Market share of fixed broadband internet service providers in Finland from 2007 to 2017Fixed broadband internet service provider market share in Finland 2007-2017
- Share of investments of the total revenue in the telecommunications sector in Finland from 2009 to 2017, by typeTelecommunications industry's investment rate in Finland 2009-2017, by type
- Price level index of telecommunication services in Finland from 2008 to 2016Price level index of telecommunication services in Finland 2008-2016
- Price level index of data transfer services in Finland from 2008 to 2016Price level index of data transfer services in Finland 2008-2016
- DNA
- Net sales of DNA from 2008 to 2018 (in million euros)Net sales of DNA 2008-2018
- EBITDA of DNA from 2008 to 2018 (in million euros)EBITDA of DNA 2008-2018
- Operating result (EBIT) of DNA from 2008 to 2018 (in million euros)EBIT of DNA 2008-2018
- Number of fixed-network subscriptions of DNA from 2008 to 2018 (in 1,000s)Number of fixed-network subscriptions of DNA 2008-2018
- Number of mobile communications subscriptions of DNA from 2008 to 2018 (in 1,000s)Number of mobile communications subscriptions of DNA 2008-2018
- Net sales of DNA from consumer business from 2013 to 2018 (in million euros)Consumer business net sales of DNA 2013-2018
- Net sales of DNA from corporate business from 2013 to 2018 (in million euros)Corporate business net sales of DNA 2013-2018
- Elisa
- Annual revenue of Elisa from 2010 to 2018 (in million euros)Annual revenue of Elisa 2010-2018
- Annual revenue of Elisa from corporate customers 2010 to 2018 (in million euros)Annual revenue of Elisa from corporate customers 2010-2018
- Annual revenue of Elisa from consumer customers 2010 to 2018 (in million euros)Annual revenue of Elisa from consumer customers 2010-2018
- EBITDA of Elisa from 2010 to 2018 (in million euros)EBITDA of Elisa 2010-2018
- Earnings per share of Elisa from 2010 to 2018 (in euros)Earnings per share of Elisa 2010-2018
- Number of employees of Elisa from 2012 to 2018Number of employees of Elisa 2012-2018
- Telia Company
- Net revenue of Telia Company from 2007 to 2018 (in billion SEK)Net revenue of Telia Company 2007-2018
- Net revenue of Telia Company in 2017 and 2018, by region (in million SEK)Net revenue of Telia Company 2017-2018, by region
- EBITDA of Telia Company from 2013 to 2018 (in million SEK)EBITDA of Telia Company 2013-2018
- Total net income of Telia Company from 2007 to 2018 (in billion SEK)Total net income of Telia Company 2007-2018
- Number of subscriptions of Telia Company in Finland from 2015 to 2018, by service (in 1,000s)Subscribers of Telia Company in Finland 2015-2018, by service
- Distribution of employees of Telia Company in 2018, by countryDistribution of employees of Telia Company 2018, by country
- Distribution of revenue of Telia Company in 2018, by serviceDistribution of revenue of Telia Company 2018, by service
- Distribution of revenue of Telia Company in 2019, by segmentDistribution of revenue of Telia Company 2019, by segment
- Customer service and customer satisfaction
- Customer satisfaction of B2C customers of telecommunication providers in Finland in 2017, by service (EPSI Rating score*)B2C customer satisfaction of telecommunication providers in Finland 2017, by service
- Customer satisfaction of B2B customers of telecommunication providers in Finland in 2017, by service (EPSI Rating score*)B2B customer satisfaction of telecommunication providers in Finland 2017, by service
- Development of customer service response times of mobile operators quarterly in Finland from the 1st quarter of 2015 to the 4th quarter of 2017 (in seconds)Customer service response times of operators in Finland 2015-2017
- Customer satisfaction of pay TV providers in Finland from 2012 to 2017 (EPSI Rating score**)Survey on customer satisfaction of pay TV providers in Finland 2012-2017
- On a scale of 0 to 100, how trustworthy do you consider your telecommunications operator?Survey on trust in telecommunications operators in Finland 2016
- On a scale of 0 to 100, how satisfied are you with the service quality of your broadband?Survey on satisfaction with broadband service quality in Finland 2015-2016, by type
- On a scale of 0 to 100, how would you rate the channel assortment of your pay TV provider?Survey on channel assortment of pay TV providers in Finland 2016
- Have you complained about your fixed-line broadband?Survey on B2C customer complaints about fixed-line broadband in Finland 2017
- Number of mobile subscribers of SmarTone 2013-2020
- Number of mobile subscribers of HKBN 2017-2020
- UK mobile network: quarterly pre-pay mobile subscribers Q1 2012-Q4 2018
- Number of mobile subscriptions in Bahrain 2012-2017
- UK mobile network: post-pay mobile subscribers Q1 2012-Q4 2018
- Telekom Austria: mobile subscribers in North Macedonia 2013-2016
- ALBtelecom: number of mobile subscribers in Albania 2012-2015
- Ethio Telecom: mobile/wireless subscribers 2012-2018, by subscription type
- ALBtelecom: number of voice subscribers in Albania 2012-2015
- ALBtelecom: number of active subscribers in Albania 2012-2015
- Quarterly number of mobile phone subscriptions in Egypt 2018
- América Móvil wireless subscribers 2014-2018
- América Móvil wireless subscribers 2018, by region
- Subscribers of Telia Company in Sweden 2015-2018, by service
- América Móvil fixed-line subscribers 2014-2018
- América Móvil: number of subscribers 2014-2018
- Subscribers of Telia Company in Denmark 2015-2018, by service
- Number of Megafon mobile subscribers 2014-2017
- Number of mobile/wireless subscribers in Pakistan 2004-2019, by operator/provider
Statista offers dossiers and reports on over 170 industries. With Statista you are always able to make informed decisions and boost your work efficiency.
- Social Media
- E-Commerce
- Online Video & Entertainment
- Advertising & Marketing
- Alcoholic Beverages
- Cleaning Products
- Cosmetics & Personal Care
- Food & Nutrition
- Health & Hygiene
- International Trade
- Shopping Behavior
- Sports & Leisure
- Business Travel
- Leisure Travel
- Accomodation
- Restaurants
- Demographics
- Economy
- Education & Science
- Politics & Government
- Aviation
- Rail Transport
- Vehicles & Road Traffic
- Water Transport
You can only download this statistic as a Premium user.
As a Premium user you get access to the detailed source references and background information about this statistic.
As a Premium user you get access to background information and details about the release of this statistic.
As soon as this statistic is updated, you will immediately be notified via e-mail.
...and make my research life easier.
You need at least a Premium Account to use this feature.
This feature is limited to our corporate solutions.
Please contact us to get started with full access to dossiers, forecasts, studies and international data.
We use cookies to personalize contents and ads, offer social media features, and analyze access to our website. In your browser settings you can configure or disable this, respectively, and can delete any already placed cookies. For details, please see your browser’s Help section (by pressing F1). Please see our privacy statement for details about how we use data.