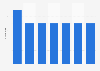
The statistic shows the share of senior characters in Oscar-nominated films in the United States from 2014 to 2016. According to the source, 16.3 percent of the characters in Best Picture-nominated movies in 2016 were aged over 60.
Share of senior characters in Oscar-nominated films in the United States from 2014 to 2016
Basic Account
Get to know the platform
You only have access to basic statistics.
This statistic is not included in your account.
Starter Account
The ideal entry-level account for individual users
- Instant access to 1m statistics
- Download in XLS, PDF & PNG format
- Detailed references
$199 USD / Month *
Professional Account
Full access
Business Solutions including all features.
* Prices do not include sales tax.
Other statistics that may interest you Statistics on
About the industry
9
- Basic Statistic Gender distribution of Academy Award nominees 2024, by non-acting category
- Basic Statistic Gender distribution of Academy Award nominees in the U.S. 2018-2024
- Premium Statistic Age of Academy Awards winners in acting categories 1929-2022, by decade
- Premium Statistic Number of Academy Awards winners in acting categories 1929-2022, by age group
- Premium Statistic Distribution of Oscar-winning movies in the U.S. 2011-2020, by lead actor gender
- Basic Statistic Oscar Best Actress nominees net worth 2019
- Premium Statistic Film studio ranking by number of "Best Picture" Academy Awards 2024
- Premium Statistic Oscars' Best Picture winners' box office in the U.S. & Canada 2001-2024
- Premium Statistic Number of Academy Awards TV viewers 2000-2024
About the region
10
- Premium Statistic Oscars' International Feature Film winners' box office worldwide 2001-2024, by region
- Premium Statistic Best Picture nominees' box office revenue in the U.S. & Canada vs. worldwide 2024
- Basic Statistic Share of girls & women in films in the U.S. 2019, by genre
- Basic Statistic Movies missing female characters in the U.S. 2019, by ethnicity
- Basic Statistic Female sexualization in top grossing films in the U.S. 2018, by age group
- Basic Statistic Attitudes to diversity in Hollywood U.S. 2019, by age
- Premium Statistic Movie-going preferences among women in the U.S. 2018
- Premium Statistic Opinion on gender diversity in the movie industry among women in the U.S. 2018
- Basic Statistic Ethnicity distribution of selected branches at the Academy Awards 1927-2015
- Basic Statistic Distribution of Medicare beneficiaries 2021, by ethnicity
Selected statistics
1
Other regions
10
- Basic Statistic Wins of the Oscar for International Feature Film 1948-2024, by country
- Premium Statistic Gross annual earnings in the film and music industry in Germany 2007-2020
- Premium Statistic Number of victories of members of Spanish film industry at the Oscars 1969-2020
- Basic Statistic Latin American wins & nominations for the International Feature Film Oscar 1956-2022
- Premium Statistic Major film awards won by UK actors and UK films 2001-2019
- Premium Statistic How media portrayals impacted the perception of aging Malaysia 2018
- Premium Statistic Most popular South Korean celebrities in China 2017
- Premium Statistic Most popular South Korean celebrities in Indonesia 2017
- Premium Statistic Most popular South Korean celebrities in France 2017
- Premium Statistic Most popular South Korean celebrities in Taiwan 2017
Related statistics
10
- Premium Statistic Actors with the most Oscars for their acting 1929-2024
- Premium Statistic Budget of "Best Picture" nominees at the Academy Awards 2021
- Basic Statistic Oscar Best Actor nominees net worth 2019
- Premium Statistic Distribution lead actors in films in the U.S. 2011-2022, by ethnicity
- Premium Statistic Distribution of lead actors in movies in the U.S. 2011-2022, by gender
- Premium Statistic Academy Awards wins in 2024, by movie distributor
- Premium Statistic Academy Awards wins in 2024, by film
- Premium Statistic Distribution of speaking characters in film in the U.S. 2002-2023, by gender
- Basic Statistic Academy Awards nominations in 2024, by film
- Basic Statistic Number of Academy Awards nominations 2024, by movie distributor
Further Content: You might find this interesting as well
Statistics
MDSC Initiative. (February 16, 2017). Share of senior characters in Oscar-nominated films in the United States from 2014 to 2016 [Graph]. In Statista. Retrieved March 19, 2024, from https://www.statista.com/statistics/785756/oscar-nominees-age-distribution/
MDSC Initiative. "Share of senior characters in Oscar-nominated films in the United States from 2014 to 2016." Chart. February 16, 2017. Statista. Accessed March 19, 2024. https://www.statista.com/statistics/785756/oscar-nominees-age-distribution/
MDSC Initiative. (2017). Share of senior characters in Oscar-nominated films in the United States from 2014 to 2016. Statista. Statista Inc.. Accessed: March 19, 2024. https://www.statista.com/statistics/785756/oscar-nominees-age-distribution/
MDSC Initiative. "Share of Senior Characters in Oscar-nominated Films in The United States from 2014 to 2016." Statista, Statista Inc., 16 Feb 2017, https://www.statista.com/statistics/785756/oscar-nominees-age-distribution/
MDSC Initiative, Share of senior characters in Oscar-nominated films in the United States from 2014 to 2016 Statista, https://www.statista.com/statistics/785756/oscar-nominees-age-distribution/ (last visited March 19, 2024)
Share of senior characters in Oscar-nominated films in the United States from 2014 to 2016 [Graph], MDSC Initiative, February 16, 2017. [Online]. Available: https://www.statista.com/statistics/785756/oscar-nominees-age-distribution/