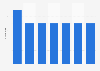
woman was nominated for an Oscar in the Directing (Best Director) category in 2023. The source analyzed the following non-acting categories: Best Picture, Best Director, Writing (Original Screenplay), Writing (Adapted Screenplay), Film Editing, Cinematography, Documentary (Feature), and Documentary (Short Subject).
In 2023, women accounted for 27 percent of the nominees for the main non-acting categories at the Academy Awards, down from 32 percent a year earlier. Not a single Distribution of non-acting Academy Award nominees in the United States from 2018 to 2023, by gender
Loading statistic...
Basic Account
Get to know the platform
You only have access to basic statistics.
Starter Account
The ideal entry-level account for individual users
- Instant access to 1m statistics
- Download in XLS, PDF & PNG format
- Detailed references
$59 USD $39 USD / Month *
in the first 12 months
Professional Account
Full access
Business Solutions including all features.
* Prices do not include sales tax.
Statistics on Academy Awards
Winners & nominees
8
- Premium Statistic Actors with the most Oscar nominations and their wins 1929-2022
- Premium Statistic Actors with the most Oscars for their acting 1929-2022
- Premium Statistic Film studio ranking by number of "Best Picture" Academy Awards 2023
- Basic Statistic Number of Academy Awards nominations 2023, by movie distributor
- Premium Statistic Academy Awards wins in 2023, by movie distributor
- Premium Statistic Netflix Academy Awards nominations 2014-2023
- Basic Statistic Academy Awards nominations in 2023, by film
- Premium Statistic Academy Awards wins in 2023, by film
Demographics & diversity
6
- Basic Statistic Gender distribution of Academy Award nominees 2023, by non-acting category
- Basic Statistic Gender distribution of Academy Award nominees in the U.S. 2018-2023
- Premium Statistic Distribution of voters at the Academy Awards 2012-2022, by gender
- Basic Statistic Distribution of voters at the Academy Awards 2022, by ethnicity
- Basic Statistic Latin American wins & nominations for the International Feature Film Oscar 1956-2022
- Premium Statistic Movies with the most Oscar nominations and their wins as of 2022
Box office & production budget
3
Audience
8
- Basic Statistic Share of adults planning to watch the Oscars ceremony in the U.S. 2023
- Basic Statistic Share of adults planning to watch the Oscars ceremony in the U.S. 2023, by gender
- Basic Statistic Share of adults planning to watch the Oscars ceremony in the U.S. 202, by generation
- Basic Statistic Share of adults interested in watching best picture Oscar winners U.S. 2023
- Premium Statistic Favorite Oscar Best Picture winners of American viewers 2023
- Premium Statistic Number of Academy Awards TV viewers 2000-2023
- Premium Statistic TV ratings during the Academy Awards 2002-2023
- Basic Statistic Likelyhood of watching the Academy Awards in the U.S. 2021-2022
Trivia
4
Further related statistics
18
- Age of Academy Awards winners in acting categories 1929-2022, by decade
- Number of Academy Awards winners in acting categories 1929-2022, by age group
- Consumers who saw or heard of the movie “Mudbound” in the U.S. 2018
- Academy Awards - best actress 2018
- Brazil: Academy Awards viewers 2019, by gender
- Consumers who saw or heard of the movie “Roman J. Israel, Esq.” in the U.S. 2018
- Share of seniors in films in the U.S. 2016
- Distribution of Oscar-winning movies in the U.S. 2011-2020, by lead actor gender
- Oscars - best actor public misconceptions 2019
- Consumers who saw or heard of the movie “Lady Bird” in the U.S. 2018
- Consumers who saw or heard of the movie “Get Out” in the U.S. 2018
- Oscars - best actress public misconceptions 2019
- Number of victories of members of Spanish film industry at the Oscars 1969-2020
- Box office revenue of "Best Foreign Language Film" Spanish winners at the Oscars 2017
- Share of Democrats who are comfortable with a female president U.S. 2019
- Share of Democrats who think a nominee who can beat Trump is important U.S. 2019
- Distribution of cinema admissions in France 2010-2017, by weekday
- Favorite French movie directors among young viewers in France 2015
Further Content: You might find this interesting as well
Statistics
- Age of Academy Awards winners in acting categories 1929-2022, by decade
- Number of Academy Awards winners in acting categories 1929-2022, by age group
- Consumers who saw or heard of the movie “Mudbound” in the U.S. 2018
- Academy Awards - best actress 2018
- Brazil: Academy Awards viewers 2019, by gender
- Consumers who saw or heard of the movie “Roman J. Israel, Esq.” in the U.S. 2018
- Share of seniors in films in the U.S. 2016
- Distribution of Oscar-winning movies in the U.S. 2011-2020, by lead actor gender
- Oscars - best actor public misconceptions 2019
- Consumers who saw or heard of the movie “Lady Bird” in the U.S. 2018
- Consumers who saw or heard of the movie “Get Out” in the U.S. 2018
- Oscars - best actress public misconceptions 2019
- Number of victories of members of Spanish film industry at the Oscars 1969-2020
- Box office revenue of "Best Foreign Language Film" Spanish winners at the Oscars 2017
- Share of Democrats who are comfortable with a female president U.S. 2019
- Share of Democrats who think a nominee who can beat Trump is important U.S. 2019
- Distribution of cinema admissions in France 2010-2017, by weekday
- Favorite French movie directors among young viewers in France 2015
Women's Media Center. (March 3, 2023). Distribution of non-acting Academy Award nominees in the United States from 2018 to 2023, by gender [Graph]. In Statista. Retrieved March 25, 2023, from https://www.statista.com/statistics/641377/oscar-nominees-gender-distribution/
Women's Media Center. "Distribution of non-acting Academy Award nominees in the United States from 2018 to 2023, by gender." Chart. March 3, 2023. Statista. Accessed March 25, 2023. https://www.statista.com/statistics/641377/oscar-nominees-gender-distribution/
Women's Media Center. (2023). Distribution of non-acting Academy Award nominees in the United States from 2018 to 2023, by gender. Statista. Statista Inc.. Accessed: March 25, 2023. https://www.statista.com/statistics/641377/oscar-nominees-gender-distribution/
Women's Media Center. "Distribution of Non-acting Academy Award Nominees in The United States from 2018 to 2023, by Gender." Statista, Statista Inc., 3 Mar 2023, https://www.statista.com/statistics/641377/oscar-nominees-gender-distribution/
Women's Media Center, Distribution of non-acting Academy Award nominees in the United States from 2018 to 2023, by gender Statista, https://www.statista.com/statistics/641377/oscar-nominees-gender-distribution/ (last visited March 25, 2023)
Distribution of non-acting Academy Award nominees in the United States from 2018 to 2023, by gender [Graph], Women's Media Center, March 3, 2023. [Online]. Available: https://www.statista.com/statistics/641377/oscar-nominees-gender-distribution/