Box office gross in China – one of the highest in the world – dropped in 2022, standing at over 30 billion yuan. This corresponds to less than half of the 2019 figure. The United States and Canada, collectively known as the North American box office and second worldwide in terms of revenue, experienced growth in comparison to the previous year and amounted to about 7.4 billion U.S. dollars as of 2022. However, the result amounts to about 60 percent of the 2019 figures.
Box office worldwide - statistics & facts
Box office gross in China – one of the highest in the world – dropped in 2022, standing at over 30 billion yuan. This corresponds to less than half of the 2019 figure. The United States and Canada, collectively known as the North American box office and second worldwide in terms of revenue, experienced growth in comparison to the previous year and amounted to about 7.4 billion U.S. dollars as of 2022. However, the result amounts to about 60 percent of the 2019 figures.
Key insights
- Global box office revenue
- 21.3bn USD
Detailed statistics
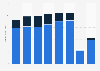
Global box office revenue 2014-2021, by format
- Top region by box office revenue
- Asia Pacific

Detailed statistics
Global box office revenue 2004-2021, by region
- Top box office market by revenue
- China

Detailed statistics
Leading box office markets worldwide 2021, by revenue
Editor’s Picks Current statistics on this topic
Current statistics on this topic
Related topics
Recommended statistics
Overview
-
Premium Statistic
Global box office revenue 2014-2021, by format
Global box office revenue 2014-2021, by format
Global box office revenue from 2014 to 2021, by format (in billion U.S. dollars)
-
Premium Statistic
Global box office revenue 2004-2021, by region
Global box office revenue 2004-2021, by region
Global box office revenue from 2004 to 2021, by region (in billion U.S. dollars)
-
Premium Statistic
Leading box office markets worldwide 2021, by revenue
Leading box office markets worldwide 2021, by revenue
Leading box office markets worldwide in 2021, by revenue (in billion U.S. dollars)
-
Premium Statistic
Leading film markets worldwide 2022, by number of tickets sold

Leading film markets worldwide 2022, by number of tickets sold
Leading film markets worldwide in 2022, by number of tickets sold (in millions)
Asia & Australia
10
- Premium Statistic Box office revenue in China 2013-2023
- Premium Statistic Number of movie tickets sold in China 2013-2023
- Premium Statistic Total box office gross in Japan 2014-2023
- Premium Statistic Number of cinema admissions in Japan 2014-2023
- Premium Statistic Gross box office revenue India 2018-2023
- Premium Statistic Gross box office revenue share India 2018-2023, by language
- Premium Statistic Box office revenue in South Korea 2004-2023
- Premium Statistic Number of cinema admissions in South Korea 2004-2023
- Premium Statistic Box office revenue in Australia 2014-2023
- Premium Statistic Number of movie tickets sold in Australia 2014-2023
Asia & Australia
-
Premium Statistic
Box office revenue in China 2013-2023

Box office revenue in China 2013-2023
Box office revenue in China from 2013 to 2023 (in billion yuan)
-
Premium Statistic
Number of movie tickets sold in China 2013-2023

Number of movie tickets sold in China 2013-2023
Number of movie tickets sold in China from 2013 to 2023 (in millions)
-
Premium Statistic
Total box office gross in Japan 2014-2023

Total box office gross in Japan 2014-2023
Total box office gross in Japan from 2014 to 2023 (in billion Japanese yen)
-
Premium Statistic
Number of cinema admissions in Japan 2014-2023

Number of cinema admissions in Japan 2014-2023
Number of movie theater admissions in Japan from 2014 to 2023 (in millions)
-
Premium Statistic
Gross box office revenue India 2018-2023

Gross box office revenue India 2018-2023
Gross box office revenue in India from 2018 to 2023 (in billion Indian rupees)
-
Premium Statistic
Gross box office revenue share India 2018-2023, by language

Gross box office revenue share India 2018-2023, by language
Distribution of gross box office revenue in India from 2018 to 2023, by language
-
Premium Statistic
Box office revenue in South Korea 2004-2023

Box office revenue in South Korea 2004-2023
Box office revenue in South Korea from 2004 to 2023 (in trillion South Korean won)
-
Premium Statistic
Number of cinema admissions in South Korea 2004-2023

Number of cinema admissions in South Korea 2004-2023
Number of cinema admissions in South Korea from 2004 to 2023 (in millions)
-
Premium Statistic
Box office revenue in Australia 2014-2023

Box office revenue in Australia 2014-2023
Box office revenue in Australia from 2014 to 2023 (in million Australian dollars)
-
Premium Statistic
Number of movie tickets sold in Australia 2014-2023

Number of movie tickets sold in Australia 2014-2023
Number of movie tickets sold in Australia from 2014 to 2023 (in millions)
United States & Canada
6
- Basic Statistic Box office revenue in the U.S. and Canada 1980-2023
- Basic Statistic Tickets sold at box offices in the U.S. & Canada1980-2023
- Basic Statistic Consumer spending on movie tickets in the U.S. 1999-2022
- Premium Statistic Movie genres ranked by average box office revenue in the U.S. & Canada 1995-2022
- Premium Statistic Box office revenue in Canada 2010-2023
- Premium Statistic Canada box office revenue share 2011-2022, by production origin
United States & Canada
-
Basic Statistic
Box office revenue in the U.S. and Canada 1980-2023

Box office revenue in the U.S. and Canada 1980-2023
Box office revenue in the United States and Canada from 1980 to 2023 (in billion U.S. dollars)
-
Basic Statistic
Tickets sold at box offices in the U.S. & Canada1980-2023

Tickets sold at box offices in the U.S. & Canada1980-2023
Number of movie tickets sold in the United States and Canada from 1980 to 2023 (in millions)
-
Basic Statistic
Consumer spending on movie tickets in the U.S. 1999-2022

Consumer spending on movie tickets in the U.S. 1999-2022
Consumer expenditure on admissions to motion picture theaters in the United States from 1999 to 2022 (in billion U.S. dollars)
-
Premium Statistic
Movie genres ranked by average box office revenue in the U.S. & Canada 1995-2022

Movie genres ranked by average box office revenue in the U.S. & Canada 1995-2022
Most popular movie genres in the United States and Canada from 1995 to 2022, by average box office revenue (in million U.S. dollars)
-
Premium Statistic
Box office revenue in Canada 2010-2023

Box office revenue in Canada 2010-2023
Box office revenue in Canada from 2010 to 2023 (in million Canadian dollars)
-
Premium Statistic
Canada box office revenue share 2011-2022, by production origin

Canada box office revenue share 2011-2022, by production origin
Distribution of box office revenue in Canada from 2011 to 2022, by origin of production
Europe
11
- Premium Statistic Box office revenue in countries in Europe 2019-2022
- Basic Statistic Revenues of cinema box office in France 2000-2022
- Premium Statistic Movie theater attendance in France 2003-2022
- Premium Statistic Cinema revenue in Germany H1 2004-H1 2023
- Premium Statistic Movie theater admissions in Germany 1993-2023
- Basic Statistic Box office revenue in the UK 2010-2022
- Premium Statistic Cinema attendance in the United Kingdom 2001-2022
- Premium Statistic Gross box office revenue in Russia 2016-2022
- Premium Statistic Cinema attendance in Russia 2018-2022
- Premium Statistic Box office revenue in Spain 2000-2022
- Premium Statistic Cinema admissions in Spain 2009-2022
Europe
-
Premium Statistic
Box office revenue in countries in Europe 2019-2022

Box office revenue in countries in Europe 2019-2022
Box office revenue in selected countries in Europe from 2019 to 2022 (in million local currency)
-
Basic Statistic
Revenues of cinema box office in France 2000-2022

Revenues of cinema box office in France 2000-2022
Revenues of movie theaters in France from 2000 to 2022 (in million euros)
-
Premium Statistic
Movie theater attendance in France 2003-2022

Movie theater attendance in France 2003-2022
Cinema ticket sales in France from 2003 to 2022 (in million tickets sold)
-
Premium Statistic
Cinema revenue in Germany H1 2004-H1 2023

Cinema revenue in Germany H1 2004-H1 2023
Cinema revenue in Germany from H1 2004 to H1 2023 (in million euros)
-
Premium Statistic
Movie theater admissions in Germany 1993-2023

Movie theater admissions in Germany 1993-2023
Number of movie theater admissions in Germany from 1993 to 2023 (in millions)
-
Basic Statistic
Box office revenue in the UK 2010-2022

Box office revenue in the UK 2010-2022
Box office revenue in the United Kingdom from 2010 to 2022 (in million GBP)
-
Premium Statistic
Cinema attendance in the United Kingdom 2001-2022

Cinema attendance in the United Kingdom 2001-2022
Cinema attendance in the United Kingdom from 2001 to 2022 (in millions)
-
Premium Statistic
Gross box office revenue in Russia 2016-2022

Gross box office revenue in Russia 2016-2022
Gross box office revenue in Russia from 2016 to 2022 (in billion Russian rubles)
-
Premium Statistic
Cinema attendance in Russia 2018-2022

Cinema attendance in Russia 2018-2022
Attendance at movie theaters in Russia from 2018 to 2022 (in millions)
-
Premium Statistic
Box office revenue in Spain 2000-2022

Box office revenue in Spain 2000-2022
Box office revenue in Spain from 2000 to 2022 (in million euros)
-
Premium Statistic
Cinema admissions in Spain 2009-2022

Cinema admissions in Spain 2009-2022
Attendance at movie theaters in Spain from 2000 to 2022 (in millions)
Latin America
7
- Premium Statistic Box office revenue in Latin America 2004-2021
- Basic Statistic Box office revenue in Mexico 2010-2023
- Basic Statistic Number of movie tickets sold in Mexico 2010-2023
- Premium Statistic Box office revenue in Brazil 2006-2022
- Premium Statistic Attendance at movie theaters in Brazil 2009-2022
- Premium Statistic Box office revenue in Argentina 2014-2022
- Premium Statistic Cinema attendance in Argentina 2014-2022
Latin America
-
Premium Statistic
Box office revenue in Latin America 2004-2021

Box office revenue in Latin America 2004-2021
Box office revenue in Latin America from 2004 to 2021 (in billion U.S. dollars)
-
Basic Statistic
Box office revenue in Mexico 2010-2023

Box office revenue in Mexico 2010-2023
Box office revenue in Mexico from 2010 to 2023 (in billion Mexican pesos)
-
Basic Statistic
Number of movie tickets sold in Mexico 2010-2023

Number of movie tickets sold in Mexico 2010-2023
Number of movie tickets sold in Mexico from 2010 to 2023 (in millions)
-
Premium Statistic
Box office revenue in Brazil 2006-2022

Box office revenue in Brazil 2006-2022
Box office revenue in Brazil from 2006 to 2022 (in million Brazilian reals)
-
Premium Statistic
Attendance at movie theaters in Brazil 2009-2022

Attendance at movie theaters in Brazil 2009-2022
Number of movie tickets sold in Brazil from 2009 to 2022 (in millions)
-
Premium Statistic
Box office revenue in Argentina 2014-2022

Box office revenue in Argentina 2014-2022
Box office revenue in Argentina from 2014 to 2022 (in billion Argentine pesos)
-
Premium Statistic
Cinema attendance in Argentina 2014-2022

Cinema attendance in Argentina 2014-2022
Cinema attendance in Argentina from 2014 to 2022 (in millions)
Africa
4
- Premium Statistic Box office revenue of cinemas in anglophone West Africa 2015-2022
- Premium Statistic Monthly box office revenue in English-speaking West-Africa 2019-2022
- Premium Statistic Cinema attendance in English-speaking West Africa 2015-2022
- Premium Statistic Revenue of the South African box office 2019-2021
Africa
-
Premium Statistic
Box office revenue of cinemas in anglophone West Africa 2015-2022

Box office revenue of cinemas in anglophone West Africa 2015-2022
Box office revenue generated by movie theaters in English-speaking West Africa from 2015 to 2022 (in billion Naira)
-
Premium Statistic
Monthly box office revenue in English-speaking West-Africa 2019-2022

Monthly box office revenue in English-speaking West-Africa 2019-2022
Box office revenue in Ghana, Liberia, and Nigeria from January 2019 to December 2022 (in 1,000 Nigerian naira)
-
Premium Statistic
Cinema attendance in English-speaking West Africa 2015-2022

Cinema attendance in English-speaking West Africa 2015-2022
Total admissions in cinemas in Liberia, Ghana, and Nigeria from 2015 to 2022
-
Premium Statistic
Revenue of the South African box office 2019-2021

Revenue of the South African box office 2019-2021
Revenue of the South African box office from 2019 to 2021 (in million U.S. dollars)
Cinema advertising outlook
6
- Premium Statistic Cinema ad spending APAC 2012-2024
- Premium Statistic Cinema advertising spending in North America 2002-2024
- Premium Statistic Cinema advertising spending in Western Europe 2000-2024
- Premium Statistic Cinema advertising spending in Central and Eastern Europe 2000-2024
- Premium Statistic Latin America: cinema ad spend 2010-2024
- Premium Statistic Cinema advertisement expenditure in MENA 2010-2024
Cinema advertising outlook
-
Premium Statistic
Cinema ad spending APAC 2012-2024

Cinema ad spending APAC 2012-2024
Cinema advertising expenditure in the Asia-Pacific region from 2012 to 2021 with forecasts to 2024 (in billion U.S. dollars)
-
Premium Statistic
Cinema advertising spending in North America 2002-2024

Cinema advertising spending in North America 2002-2024
Cinema advertising spending in North America from 2002 to 2024 (in million U.S. dollars)
-
Premium Statistic
Cinema advertising spending in Western Europe 2000-2024

Cinema advertising spending in Western Europe 2000-2024
Cinema advertising expenditure in Western Europe from 2000 to 2024 (in million U.S. dollars)
-
Premium Statistic
Cinema advertising spending in Central and Eastern Europe 2000-2024

Cinema advertising spending in Central and Eastern Europe 2000-2024
Cinema advertising expenditure in Central and Eastern Europe (CEE) from 2000 to 2024 (in million U.S. dollars)
-
Premium Statistic
Latin America: cinema ad spend 2010-2024

Latin America: cinema ad spend 2010-2024
Cinema advertising expenditure in Latin America from 2010 to 2024 (in million U.S. dollars)
-
Premium Statistic
Cinema advertisement expenditure in MENA 2010-2024

Cinema advertisement expenditure in MENA 2010-2024
Value of cinema advertisement expenditure in the Middle East and North Africa from 2010 to 2024 (in million U.S. dollars)
Further reportsGet the best reports to understand your industry
Get the best reports to understand your industry


Contact
Get in touch with us. We are happy to help.


Meredith Alda
Sales Manager– Contact (United States)
Mon - Fri, 9am - 6pm (EST)
Yolanda Mega
Operations Manager– Contact (Asia)
Mon - Fri, 9am - 5pm (SGT)
Kisara Mizuno
Senior Business Development Manager– Contact (Asia)
Mon - Fri, 10:00am - 6:00pm (JST)
Lodovica Biagi
Director of Operations– Contact (Europe)
Mon - Fri, 9:30am - 5pm (GMT)
Carolina Dulin
Group Director - LATAM– Contact (Latin America)
Mon - Fri, 9am - 6pm (EST)