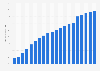
This statistic shows the share of average daily time spent using internet on different devices in China from 2014 to 2017 with projections until 2020. In 2017, Chinese internet users spent on average 66 percent of their online time on mobile devices.
Share of average time spent per day using internet by adults in China from 2014 to 2020, by device
According to the source, time spent per medium refers to the overall time spent with that medium, regardless of multitasking. For example, one hour of multitasking on desktop/laptop while watching TV is counted as one hour for TV and one hour for desktop/laptop.
Profit from the additional features of your individual account
Currently, you are using a shared account. To use individual functions (e.g., mark statistics as favourites, set
statistic alerts) please log in with your personal account.
If you are an admin, please authenticate by logging in again.
Learn more about how Statista can support your business.
eMarketer. (April 25, 2018). Share of average time spent per day using internet by adults in China from 2014 to 2020, by device [Graph]. In Statista. Retrieved September 19, 2024, from https://www.statista.com/statistics/944439/china-average-daily-time-spent-using-internet-by-device/
eMarketer. "Share of average time spent per day using internet by adults in China from 2014 to 2020, by device." Chart. April 25, 2018. Statista. Accessed September 19, 2024. https://www.statista.com/statistics/944439/china-average-daily-time-spent-using-internet-by-device/
eMarketer. (2018). Share of average time spent per day using internet by adults in China from 2014 to 2020, by device. Statista. Statista Inc.. Accessed: September 19, 2024. https://www.statista.com/statistics/944439/china-average-daily-time-spent-using-internet-by-device/
eMarketer. "Share of Average Time Spent per Day Using Internet by Adults in China from 2014 to 2020, by Device." Statista, Statista Inc., 25 Apr 2018, https://www.statista.com/statistics/944439/china-average-daily-time-spent-using-internet-by-device/
eMarketer, Share of average time spent per day using internet by adults in China from 2014 to 2020, by device Statista, https://www.statista.com/statistics/944439/china-average-daily-time-spent-using-internet-by-device/ (last visited September 19, 2024)
Share of average time spent per day using internet by adults in China from 2014 to 2020, by device [Graph], eMarketer, April 25, 2018. [Online]. Available: https://www.statista.com/statistics/944439/china-average-daily-time-spent-using-internet-by-device/