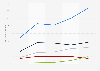
Average value of proptech deals in the U.S. 2013-2023
The average deal value in the U.S. proptech sector in 2023 has declined notably since its peak in 2021. In the second half of 2021, the average deal value was 48.9 million U.S. dollars. By the second half of 2023, this value had fallen to 16.8 million U.S. dollars. According to the source, the slowdown in investment activity is a result of increased caution among investors and a general shift toward responsible growth strategies, visibility of revenues, and improved profitability.