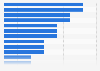
Share of visitors to cultural or sporting facilities South Korea 2011-2023
According to a survey conducted in South Korea in 2023, around 55 percent of respondents stated that they visited a cultural or sporting facility within the previous year. Women demonstrated higher attendance than men.