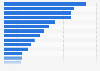
According to a 2022 study conducted on free mobile apps and games, approximately 6.5 percent of Android and iOS apps uses Cordova. Unity ranked second, powering 6.45 percent of all apps, while Meta Platforms-owned React Native ranked third powering a share of approximately 5.3 percent of mobile apps and games.
Most used engines by mobile app and games developers worldwide as of July 2022
Basic Account
Get to know the platform
You only have access to basic statistics.
This statistic is not included in your account.
Starter Account
The ideal entry-level account for individual users
- Instant access to 1m statistics
- Download in XLS, PDF & PNG format
- Detailed references
$199 USD / Month *
Professional Account
Full access
Business Solutions including all features.
* Prices do not include sales tax.
Other statistics that may interest you Statistics on
About the industry
10
- Basic Statistic Most downloaded Google apps worldwide 2023
- Premium Statistic Average price of paid Amazon Appstore apps 2024
- Basic Statistic Distribution of free and paid iOS apps 2019-2024
- Premium Statistic Average price of paid Android apps 2024
- Premium Statistic Monthly active users of leading music apps in China 2023
- Premium Statistic Global IAP revenue of Facebook Messenger 2017-2023
- Basic Statistic Mobile app categories with highest uninstall rate 2023
- Premium Statistic Most downloaded travel apps worldwide 2022, by aggregated downloads
- Premium Statistic Number of aggregated downloads of leading online travel agency apps worldwide 2023
- Premium Statistic Leading Android apps in the Netherlands 2022, by revenue
About the region
10
- Basic Statistic Countries with the most Snapchat users 2024
- Basic Statistic Apple App Store: number of available gaming apps as of Q3 2022
- Basic Statistic Google Play: number of available apps as of Q3 2022
- Basic Statistic Amazon Appstore: number of available gaming apps as of Q3 2022
- Premium Statistic Apple App Store: growth of available apps Q3 2022, by category
- Premium Statistic Amazon Appstore: number of available kids apps as of Q3 2022
- Premium Statistic Apple App Store: number of available apps as of Q3 2022
- Basic Statistic Most popular Apple App Store categories 2022
- Basic Statistic Google Play: number of available gaming apps as of Q3 2022
- Basic Statistic Leading non-gaming iPhone app publishers worldwide 2022, by downloads
Other regions
10
- Premium Statistic Monthly active users of leading third-party app stores in China 2023
- Premium Statistic Leading non-gaming Android app publishers in Sweden 2022, by downloads
- Premium Statistic Willingness of people in Ireland to pay for advert-free versions of popular apps 2018
- Premium Statistic Monthly cost per install of gaming apps in Southeast Asia 2018-2019
- Premium Statistic Willingness to switch to 5G when available MENA 2019, by country
- Basic Statistic Brazil: change in usage of apps due to COVID-19 as of March2020
- Premium Statistic Colombia: use of digital platforms 2020
- Basic Statistic Most popular navigation apps in the U.S. 2023, by downloads
- Premium Statistic Share of online consumers who use news aggregator apps in Australia 2020 by app
- Premium Statistic LINE Corporation's quarterly revenue 2013-2020
Related statistics
10
- Premium Statistic Leading Italian TikTok creators 2024, by number of followers
- Basic Statistic Leading weekly smartphone activities by U.S. Millennials 2022
- Premium Statistic Leading Android social media apps in the Netherlands 2022, by revenue
- Premium Statistic Leading Android music and audio apps in the Netherlands 2022, by revenue
- Premium Statistic Leading Android news and magazine apps in the Netherlands 2022, by revenue
- Premium Statistic Leading Android communication apps in the Netherlands 2022, by revenue
- Premium Statistic Leading Android shopping apps in the Netherlands 2022, by revenue
- Premium Statistic Leading Android health and fitness apps in the Netherlands 2022, by revenue
- Premium Statistic Amazon Appstore: growth of available apps Q3 2022, by category
- Premium Statistic Leading non-gaming iPhone app publishers in the U.S. 2022, by revenue
Further related statistics
2
Further Content: You might find this interesting as well
Appfigures. (July 29, 2022). Most used engines by mobile app and games developers worldwide as of July 2022 [Graph]. In Statista. Retrieved April 26, 2024, from https://www.statista.com/statistics/1326121/top-app-dev-engines-worldwide/
Appfigures. "Most used engines by mobile app and games developers worldwide as of July 2022." Chart. July 29, 2022. Statista. Accessed April 26, 2024. https://www.statista.com/statistics/1326121/top-app-dev-engines-worldwide/
Appfigures. (2022). Most used engines by mobile app and games developers worldwide as of July 2022. Statista. Statista Inc.. Accessed: April 26, 2024. https://www.statista.com/statistics/1326121/top-app-dev-engines-worldwide/
Appfigures. "Most Used Engines by Mobile App and Games Developers Worldwide as of July 2022." Statista, Statista Inc., 29 Jul 2022, https://www.statista.com/statistics/1326121/top-app-dev-engines-worldwide/
Appfigures, Most used engines by mobile app and games developers worldwide as of July 2022 Statista, https://www.statista.com/statistics/1326121/top-app-dev-engines-worldwide/ (last visited April 26, 2024)
Most used engines by mobile app and games developers worldwide as of July 2022 [Graph], Appfigures, July 29, 2022. [Online]. Available: https://www.statista.com/statistics/1326121/top-app-dev-engines-worldwide/