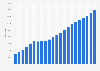
Number of Starbucks stores in the UK from 2005 to 2023
Starbucks had a total of 1,266 stores in the United Kingdom in 2023. The majority of these stores, 911, were franchised. However, the company still accounted for 355 company-operated locations.