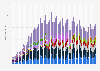
The forecast illustrates the 3G mobile device shipments in Asia from 2008 to 2020. In 2009, the 3G mobile device shipments amounted to 188 billion units in Asia.
3G mobile device shipments in Asia from 2008 to 2020 (in 1,000 units)
Loading statistic...
Basic Account
Get to know the platform
You only have access to basic statistics.
Starter Account
The ideal entry-level account for individual users
- Instant access to 1m statistics
- Download in XLS, PDF & PNG format
- Detailed references
$59 USD $39 USD / Month *
in the first 12 months
Professional Account
Full access
Corporate solution including all features.
* Prices do not include sales tax.
Statistics on Mobile devices in Norway
Overview
6
- Premium Statistic Smartphone penetration in the Nordics 2019
- Premium Statistic Market share of leading mobile device vendors in Norway 2010-2021
- Premium Statistic Number of mobile phone subscriptions in the Nordic countries 2019-2020
- Premium Statistic Largest providers of mobile phone subscriptions in Norway 2019-2021, by market share
- Basic Statistic Norway: share of web traffic 2021, by device
- Premium Statistic Search engine host market share on mobile in Norway 2022
Segment: Smartphones
5
- Premium Statistic Smartphone penetration forecast in Norway 2013-2028
- Premium Statistic Smartphone user penetration in Norway 2019, by age group
- Premium Statistic Children's ownership of mobile phones in Norway 2020, by age and gender
- Premium Statistic Norway: most popular Android smartphone models 2022
- Premium Statistic Market share held by mobile operating systems in Norway 2021
Segment: Tablets
6
- Premium Statistic Laptop & tablet market revenue in Norway 2016-2021
- Premium Statistic Tablet users in Norway 2019-2028
- Premium Statistic Tablet user penetration in Norway 2021, by age group
- Premium Statistic Tablet user penetration in Norway 2019-2020, by tablet model
- Premium Statistic Market share held by tablet operating systems in Norway 2021
- Premium Statistic Market share held by the leading tablet search engines in Norway 2022
Segment: Applications
5
- Premium Statistic Number of apps installed by mobile users in Norway 2019
- Premium Statistic Mobile apps ranked by importance in Norway 2020
- Premium Statistic Leading iPhone apps in Norway 2022, by number of downloads
- Premium Statistic Leading iPad apps in Norway 2022, by downloads
- Premium Statistic Leading Android apps in Norway 2022, by downloads
Consumption
7
- Premium Statistic Mobile internet usage penetration in Norway 2021, by device
- Premium Statistic Number of SMS sent from mobile telephone in Norway 2007-2020
- Basic Statistic Daily mobile internet usage via smartphones in Norway 2010-2021
- Basic Statistic Mobile internet usage via smartphones in Norway 2021, by age group
- Premium Statistic Leading websites used on tablet in Norway 2019, by number of users
- Premium Statistic Usage of social media networks in Norway 2019, by device
- Basic Statistic Negative side effects of smartphone addiction in selected Nordic countries 2019
Further related statistics
4
- Eastern Europe: market share of global 2G mobile device shipments 2008-2020
- Middle East & Africa: market share of global 4G mobile device shipments 2010-2020
- Western Europe: market share of global 4G mobile device shipments 2010-2020
- Mobile and fixed voice traffic: growth and decline in Europe 2011-2019
Further Content: You might find this interesting as well
Statistics
- Eastern Europe: market share of global 2G mobile device shipments 2008-2020
- Middle East & Africa: market share of global 4G mobile device shipments 2010-2020
- Western Europe: market share of global 4G mobile device shipments 2010-2020
- Mobile and fixed voice traffic: growth and decline in Europe 2011-2019
Jefferies & Company. (September 8, 2011). 3G mobile device shipments in Asia from 2008 to 2020 (in 1,000 units) [Graph]. In Statista. Retrieved February 06, 2023, from https://www.statista.com/statistics/224868/3g-mobile-device-shipment-forecast-in-asia/
Jefferies & Company. "3G mobile device shipments in Asia from 2008 to 2020 (in 1,000 units)." Chart. September 8, 2011. Statista. Accessed February 06, 2023. https://www.statista.com/statistics/224868/3g-mobile-device-shipment-forecast-in-asia/
Jefferies & Company. (2011). 3G mobile device shipments in Asia from 2008 to 2020 (in 1,000 units). Statista. Statista Inc.. Accessed: February 06, 2023. https://www.statista.com/statistics/224868/3g-mobile-device-shipment-forecast-in-asia/
Jefferies & Company. "3g Mobile Device Shipments in Asia from 2008 to 2020 (in 1,000 Units)." Statista, Statista Inc., 8 Sep 2011, https://www.statista.com/statistics/224868/3g-mobile-device-shipment-forecast-in-asia/
Jefferies & Company, 3G mobile device shipments in Asia from 2008 to 2020 (in 1,000 units) Statista, https://www.statista.com/statistics/224868/3g-mobile-device-shipment-forecast-in-asia/ (last visited February 06, 2023)
3G mobile device shipments in Asia from 2008 to 2020 (in 1,000 units) [Graph], Jefferies & Company, September 8, 2011. [Online]. Available: https://www.statista.com/statistics/224868/3g-mobile-device-shipment-forecast-in-asia/