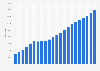
This timeline depicts the Robusta coffee production worldwide from 2000/01 to 2022/23. In 2022/23, global Robusta coffee production amounted to about 80.01 million 60 kilogram bags.
Robusta coffee production worldwide from 2005/06 to 2022/23 (in 1,000 60 kilogram bags)
Basic Account
Get to know the platform
You only have access to basic statistics.
This statistic is not included in your account.
Starter Account
The ideal entry-level account for individual users
- Instant access to 1m statistics
- Download in XLS, PDF & PNG format
- Detailed references
$69 USD $49 USD / Month *
in the first 12 months
Professional Account
Full access
Business Solutions including all features.
* Prices do not include sales tax.
Other statistics that may interest you
Overview
6
- Premium Statistic Revenue of the coffee market worldwide by country 2022
- Premium Statistic Coffee market: worldwide production 2003/04-2020/21
- Basic Statistic Leading countries worldwide based on coffee area harvested 2021
- Premium Statistic Total coffee imports and exports worldwide 2005/06-2022/23
- Basic Statistic Average prices for Arabica and robusta coffee worldwide from 2014 to 2024
- Premium Statistic Global coffee consumption 2012/13-2020/21
Production and trade
6
- Premium Statistic Global Arabica coffee production 2005/06-2022/23
- Premium Statistic Global Robusta coffee production 2005/06-2022/23
- Premium Statistic Global coffee production 2021, by region
- Premium Statistic Global coffee production 2020, by country
- Basic Statistic Major coffee importing countries worldwide 2021
- Basic Statistic Major coffee exporting countries worldwide 2021
Leading coffee companies
4
Fairtrade
4
- Premium Statistic Global UTZ certified coffee production volume 2011-2021
- Premium Statistic UTZ certified coffee: global number of producing countries 2011-2021
- Premium Statistic Global area of UTZ certified coffee 2011-2021
- Premium Statistic Sales volume of Fairtrade International worldwide 2021, by product
Further related statistics
20
- U.S. coffee production value in Hawaii and Puerto Rico 2000/01-2019/20
- U.S. coffee production areas in Hawaii and Puerto Rico 2000-2020
- U.S. coffee production in Hawaii and Puerto Rico 2000/01-2019/20
- Production volume of robusta coffee Malaysia 2013-2022
- U.S. consumers: daily coffee drinking consumption at home during the week 2019
- Coffee drinking U.S. consumers by cup size 2020
- Coffee drinking U.S. consumers by time of day 2020
- Drip coffee consumption in the U.S. 2019, by location
- Production volume of coffee of Anders Löfberg 2010-2017
- U.S. share of coffee consumption by ethnicity 2020
- Peru: coffee production 2015-2030
- Liquid coffee production volume in South Korea 2010-2018
- Colombia: coffee production payroll 2014-2017
- Consumer engagement with coffee beans in South Korea 2016
- Specialty coffee consumption by females in Canada 2016
- Retail price of coffee in Poland 2020, by city
- Production volume of coffee in non-traditional areas India FY 2023, by region
- Production volume of Arabica coffee in Kerala India FY 2023, by district
- Latin America: UTZ Certified coffee production 2017-2019
- Willingness to pay for a small coffee to go in the U.S. 2019
Further Content: You might find this interesting as well
Statistics
- U.S. coffee production value in Hawaii and Puerto Rico 2000/01-2019/20
- U.S. coffee production areas in Hawaii and Puerto Rico 2000-2020
- U.S. coffee production in Hawaii and Puerto Rico 2000/01-2019/20
- Production volume of robusta coffee Malaysia 2013-2022
- U.S. consumers: daily coffee drinking consumption at home during the week 2019
- Coffee drinking U.S. consumers by cup size 2020
- Coffee drinking U.S. consumers by time of day 2020
- Drip coffee consumption in the U.S. 2019, by location
- Production volume of coffee of Anders Löfberg 2010-2017
- U.S. share of coffee consumption by ethnicity 2020
- Peru: coffee production 2015-2030
- Liquid coffee production volume in South Korea 2010-2018
- Colombia: coffee production payroll 2014-2017
- Consumer engagement with coffee beans in South Korea 2016
- Specialty coffee consumption by females in Canada 2016
- Retail price of coffee in Poland 2020, by city
- Production volume of coffee in non-traditional areas India FY 2023, by region
- Production volume of Arabica coffee in Kerala India FY 2023, by district
- Latin America: UTZ Certified coffee production 2017-2019
- Willingness to pay for a small coffee to go in the U.S. 2019
USDA Foreign Agricultural Service. (December 16, 2022). Robusta coffee production worldwide from 2005/06 to 2022/23 (in 1,000 60 kilogram bags) [Graph]. In Statista. Retrieved June 03, 2023, from https://www.statista.com/statistics/225402/world-robusta-coffee-production/
USDA Foreign Agricultural Service. "Robusta coffee production worldwide from 2005/06 to 2022/23 (in 1,000 60 kilogram bags)." Chart. December 16, 2022. Statista. Accessed June 03, 2023. https://www.statista.com/statistics/225402/world-robusta-coffee-production/
USDA Foreign Agricultural Service. (2022). Robusta coffee production worldwide from 2005/06 to 2022/23 (in 1,000 60 kilogram bags). Statista. Statista Inc.. Accessed: June 03, 2023. https://www.statista.com/statistics/225402/world-robusta-coffee-production/
USDA Foreign Agricultural Service. "Robusta Coffee Production Worldwide from 2005/06 to 2022/23 (in 1,000 60 Kilogram Bags)." Statista, Statista Inc., 16 Dec 2022, https://www.statista.com/statistics/225402/world-robusta-coffee-production/
USDA Foreign Agricultural Service, Robusta coffee production worldwide from 2005/06 to 2022/23 (in 1,000 60 kilogram bags) Statista, https://www.statista.com/statistics/225402/world-robusta-coffee-production/ (last visited June 03, 2023)
Robusta coffee production worldwide from 2005/06 to 2022/23 (in 1,000 60 kilogram bags) [Graph], USDA Foreign Agricultural Service, December 16, 2022. [Online]. Available: https://www.statista.com/statistics/225402/world-robusta-coffee-production/