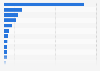
This statistic shows the share of the weekly viewing audience who watched on average up to four free online television episodes a week in the United States from 2011 to 2016, with a forecast thereof for 2017. According to the source, 17 percent of the viewing audience watched free online TV in 2016.
Share of the weekly viewing audience watching free online TV in the United States from 2011 to 2017
* Estimate. ** Forecast. Note: The statistic concerns the share of audience members who watched on average one-two (in the 2013 edition of the report) or two-three (in the 2014 edition of the report) or three (in the 2015 edition) or four (in the 2016 and 2017 editions) episodes a week at a broadcaster or cable network or one of their distribution partner's websites (CBS Audience Network & Hulu/partners). Free online TV does not include Hulu Plus, iTunes, Netflix etc or sites requiring a paid subscription. Figures for the period 2011 to 2014 come from previous editions of the report.
Profit from the additional features of your individual account
Currently, you are using a shared account. To use individual functions (e.g., mark statistics as favourites, set
statistic alerts) please log in with your personal account.
If you are an admin, please authenticate by logging in again.
Learn more about how Statista can support your business.
Convergence Consulting Group. (May 1, 2017). Share of the weekly viewing audience watching free online TV in the United States from 2011 to 2017 [Graph]. In Statista. Retrieved September 01, 2024, from https://www.statista.com/statistics/258433/share-of-audience-watching-free-online-tv-weekly-in-the-us/
Convergence Consulting Group. "Share of the weekly viewing audience watching free online TV in the United States from 2011 to 2017." Chart. May 1, 2017. Statista. Accessed September 01, 2024. https://www.statista.com/statistics/258433/share-of-audience-watching-free-online-tv-weekly-in-the-us/
Convergence Consulting Group. (2017). Share of the weekly viewing audience watching free online TV in the United States from 2011 to 2017. Statista. Statista Inc.. Accessed: September 01, 2024. https://www.statista.com/statistics/258433/share-of-audience-watching-free-online-tv-weekly-in-the-us/
Convergence Consulting Group. "Share of The Weekly Viewing Audience Watching Free Online Tv in The United States from 2011 to 2017." Statista, Statista Inc., 1 May 2017, https://www.statista.com/statistics/258433/share-of-audience-watching-free-online-tv-weekly-in-the-us/
Convergence Consulting Group, Share of the weekly viewing audience watching free online TV in the United States from 2011 to 2017 Statista, https://www.statista.com/statistics/258433/share-of-audience-watching-free-online-tv-weekly-in-the-us/ (last visited September 01, 2024)
Share of the weekly viewing audience watching free online TV in the United States from 2011 to 2017 [Graph], Convergence Consulting Group, May 1, 2017. [Online]. Available: https://www.statista.com/statistics/258433/share-of-audience-watching-free-online-tv-weekly-in-the-us/