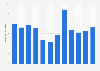
This statistic depicts the market share of ready-to-drink coffee and dairy-based drinks of the non-carbonated soft drink segment in the United States from 2012 to 2019, based on retail dollar sales. In 2019, RTD coffee and dairy-based drinks held a 5.8 percent share of the non-carbonated soft drink market.
Market share of ready-to-drink coffee and dairy-based drinks of the non-carbonated soft drink segment in the United States from 2012 to 2019
Characteristic
Market share
-
-
-
-
-
-
-
-
-
-
-
-
-
-
-
-
Exclusive Premium Statistic
To access all Premium Statistics, you need a paid Statista Account
Profit from the additional features of your individual account
Currently, you are using a shared account. To use individual functions (e.g., mark statistics as favourites, set
statistic alerts) please log in with your personal account.
If you are an admin, please authenticate by logging in again.
Learn more about how Statista can support your business.
Beverage Digest. (May 30, 2020). Market share of ready-to-drink coffee and dairy-based drinks of the non-carbonated soft drink segment in the United States from 2012 to 2019 [Graph]. In Statista. Retrieved July 27, 2024, from https://www.statista.com/statistics/505023/us-market-share-of-dairy-based-drinks/
Beverage Digest. "Market share of ready-to-drink coffee and dairy-based drinks of the non-carbonated soft drink segment in the United States from 2012 to 2019." Chart. May 30, 2020. Statista. Accessed July 27, 2024. https://www.statista.com/statistics/505023/us-market-share-of-dairy-based-drinks/
Beverage Digest. (2020). Market share of ready-to-drink coffee and dairy-based drinks of the non-carbonated soft drink segment in the United States from 2012 to 2019. Statista. Statista Inc.. Accessed: July 27, 2024. https://www.statista.com/statistics/505023/us-market-share-of-dairy-based-drinks/
Beverage Digest. "Market Share of Ready-to-drink Coffee and Dairy-based Drinks of The Non-carbonated Soft Drink Segment in The United States from 2012 to 2019." Statista, Statista Inc., 30 May 2020, https://www.statista.com/statistics/505023/us-market-share-of-dairy-based-drinks/
Beverage Digest, Market share of ready-to-drink coffee and dairy-based drinks of the non-carbonated soft drink segment in the United States from 2012 to 2019 Statista, https://www.statista.com/statistics/505023/us-market-share-of-dairy-based-drinks/ (last visited July 27, 2024)
Market share of ready-to-drink coffee and dairy-based drinks of the non-carbonated soft drink segment in the United States from 2012 to 2019 [Graph], Beverage Digest, May 30, 2020. [Online]. Available: https://www.statista.com/statistics/505023/us-market-share-of-dairy-based-drinks/