Try our business solution for free!

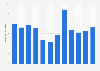
Most preferred locations to buy beverages in China 2020

Leading locations for beverage purchases among respondents in China in 2020

Download
Show detailed source information?
Register for free
Already a member?
Log in
Source

Use Ask Statista Research Service

In cooperation with
KuRunData
Release date

January 2021

Region

China

Survey time period

2020

Number of respondents

1,043 respondents

Special properties

multiple answers were allowed

Method of interview

Online survey

Supplementary notes

Original question: where do you usually purchase beverages?

The survey was conducted among 1,043 respondents, with an average age of 27.07 years old.
26.46 percent of respondents were male, and 73.54 percent of respondents were female.
40.84 percent of respondents were from the first-tier cities, 31.16 percent were from the new first-tier cities, 14.57 percent were from the second-tier cities, 8.05 percent were from the third-tier cities, 3.45 percent were from the fourth-tier cities, and 1.92 percent were from the fifth-tier cities.

Citation formats
Statista Accounts: Access All Statistics. Starting from $468 USD / Year
Basic Account
Get to know the platform

You only have access to basic statistics.
This statistic is not included in your account.

Starter Account
The ideal entry-level account for individual users
  • Instant access to 1m statistics
  • Download in XLS, PDF & PNG format
  • Detailed references
$59 USD $39 USD / Month *
in the first 12 months
Professional Account
Full access

Business Solutions including all features.

* Prices do not include sales tax.

Statistics on " Non-alcoholic beverages in China "

Statistics on Non-alcoholic beverages in China

Market overview

5

Retail

5

Major product types

5

Leading brands

5

Consumption

5

Further related statistics

19

Further Content: You might find this interesting as well

Statista Accounts: Access All Statistics. Starting from $468 USD / Year
Learn more about how Statista can support your business.