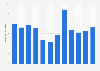
This statistic depicts the carbonated soft drink (CSD) volume worldwide in 2015, by region. That year, North America had a CSD volume of approximately 51.16 billion liters. The global CSD volume amounted to nearly 204.64 billion liters.
Carbonated soft drink (CSD) volume worldwide in 2015, by region (in billion liters)
Basic Account
Get to know the platform
You only have access to basic statistics.
This statistic is not included in your account.
Starter Account
The ideal entry-level account for individual users
- Instant access to 1m statistics
- Download in XLS, PDF & PNG format
- Detailed references
$149 USD / Month *
Professional Account
Full access
Business Solutions including all features.
* Prices do not include sales tax.
Other statistics that may interest you Statistics on
About the industry
10
- Premium Statistic Global CSD volume share 2015, by region
- Premium Statistic Soft drink per capita consumption in the ten most populated countries worldwide 2019
- Premium Statistic Global volume sales share of liquid refreshment beverages (LRB) 2019, by category
- Premium Statistic Global volume sales of liquid refreshment beverages (LRB) 2019, by category
- Premium Statistic Production volume of fruit and vegetable juices in the Netherlands 2020, by type
- Premium Statistic Production volume of fruit and vegetable juices in France 2019, by type
- Premium Statistic Production volume of fruit and vegetable juices in Denmark 2019, by type
- Premium Statistic Production volume of fruit and vegetable juices in Sweden 2019, by type
- Premium Statistic U.S. sales value growth of LRB 2018-2019, by type
- Premium Statistic Production volume of fruit and vegetable juices in Serbia 2017, by type
About the region
10
- Premium Statistic Off-trade volume of juices worldwide 2015, by category
- Premium Statistic Global consumption of packed beverages 2022, by beverage type
- Premium Statistic Bottled water market: volume share worldwide 2015-2020, by country
- Basic Statistic Bottled water market: volume growth by country 2011
- Premium Statistic Bottled water market: volume share worldwide by type 2006-2011
- Premium Statistic The Coca-Cola Company: global unit sales volume share 2021, by region
- Premium Statistic Share of global consumption of packed beverages 2022, by beverage type
- Premium Statistic Packaged water: global market volume share 2015, by category
- Premium Statistic Packaged water: global market value share 2015, by category
- Premium Statistic Packaged water: global market volume 2015, by category
Other regions
10
- Basic Statistic Bottled water: Consumption volume in the United Kingdom 2013-2022
- Premium Statistic Production volume of tomato juice in the EU 2017, by country
- Premium Statistic U.S. sales volume growth of liquid refreshment beverages 2011-2022
- Premium Statistic Production volume of fruit and vegetable juices in Romania 2017, by type
- Premium Statistic Production volume of fruit and vegetable juices in Germany 2017, by type
- Premium Statistic Production volume of fruit and vegetable juices in Belgium 2017, by type
- Premium Statistic Production volume of fruit and vegetable juices in Finland 2017, by type
- Premium Statistic Production volume of fruit and vegetable juices in Poland 2017, by type
- Premium Statistic Production volume of fruit and vegetable juices in Hungary 2017, by type
- Premium Statistic Production volume of fruit and vegetable juices in Lithuania 2017, by type
Related statistics
10
- Premium Statistic U.S. sales volume of liquid refreshment beverages 2007-2022
- Premium Statistic U.S. sales volume growth of LRB 2018-2019, by segment
- Premium Statistic Volume growth of bottled water in the U.S. 2007-2022
- Premium Statistic Volume of bottled water sold in the U.S. 2010-2022
- Premium Statistic U.S. sales value growth of non-alcoholic beverages 2022, by segment
- Premium Statistic Leading ready-to-drink tea brands in the U.S. based on sales 2023
- Basic Statistic Soft drinks: carbonates by regular, mid and no calorie in the United Kingdom 2022
- Premium Statistic Sales volume of soft drink brands of the Keurig Dr Pepper Group in the U.S. 2022
- Premium Statistic Dollar sales change of packaged beverages in U.S. C-stores 2018-2019, by type
- Premium Statistic Segment growth of bottled water in the U.S. 2015
Further related statistics
10
- Soft drinks: Consumption of carbonated drinks in the United Kingdom 2013-2022
- Global net sales of Monster Beverage 2008-2022
- Global sales share of Monster Beverage by distribution channel 2010-2022
- Workforce of Dr Pepper Snapple worldwide 2011-2017
- Consumers' likelihood of choosing soft drinks in the UK 2012, by gender
- Revenue distribution of the Coca-Cola Company worldwide 2022, by operating segment
- Mondelez International's operating income worldwide 2011-2022
- Mondelez International's global workforce by region 2012-2022
- Mondelez International's net revenue distribution worldwide by sector 2022
- Revenue and financial key figures of Coca-Cola 2010-2022
Further Content: You might find this interesting as well
Statistics
- Soft drinks: Consumption of carbonated drinks in the United Kingdom 2013-2022
- Global net sales of Monster Beverage 2008-2022
- Global sales share of Monster Beverage by distribution channel 2010-2022
- Workforce of Dr Pepper Snapple worldwide 2011-2017
- Consumers' likelihood of choosing soft drinks in the UK 2012, by gender
- Revenue distribution of the Coca-Cola Company worldwide 2022, by operating segment
- Mondelez International's operating income worldwide 2011-2022
- Mondelez International's global workforce by region 2012-2022
- Mondelez International's net revenue distribution worldwide by sector 2022
- Revenue and financial key figures of Coca-Cola 2010-2022
Zenith, & Beverage Digest. (May 10, 2016). Carbonated soft drink (CSD) volume worldwide in 2015, by region (in billion liters) [Graph]. In Statista. Retrieved December 09, 2023, from https://www.statista.com/statistics/505809/global-csd-volume-by-region/
Zenith, und Beverage Digest. "Carbonated soft drink (CSD) volume worldwide in 2015, by region (in billion liters)." Chart. May 10, 2016. Statista. Accessed December 09, 2023. https://www.statista.com/statistics/505809/global-csd-volume-by-region/
Zenith, Beverage Digest. (2016). Carbonated soft drink (CSD) volume worldwide in 2015, by region (in billion liters). Statista. Statista Inc.. Accessed: December 09, 2023. https://www.statista.com/statistics/505809/global-csd-volume-by-region/
Zenith, and Beverage Digest. "Carbonated Soft Drink (Csd) Volume Worldwide in 2015, by Region (in Billion Liters)." Statista, Statista Inc., 10 May 2016, https://www.statista.com/statistics/505809/global-csd-volume-by-region/
Zenith & Beverage Digest, Carbonated soft drink (CSD) volume worldwide in 2015, by region (in billion liters) Statista, https://www.statista.com/statistics/505809/global-csd-volume-by-region/ (last visited December 09, 2023)
Carbonated soft drink (CSD) volume worldwide in 2015, by region (in billion liters) [Graph], Zenith, & Beverage Digest, May 10, 2016. [Online]. Available: https://www.statista.com/statistics/505809/global-csd-volume-by-region/