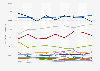
This statistic shows the annual total output value of cereals in Scotland from 2003 to 2019. The total output value of cereals has fluctuated during this period of time, peaking in 2011 at over 461 million British pounds. Additionally, the annual value of cereal production output in Scotland broken down by type of crop can be found at the
Annual output value of cereals produced in Scotland from 2003 to 2019* (in million GBP)
Basic Account
Get to know the platform
You only have access to basic statistics.
This statistic is not included in your account.
Starter Account
The ideal entry-level account for individual users
- Instant access to 1m statistics
- Download in XLS, PDF & PNG format
- Detailed references
$59 USD $39 USD / Month *
in the first 12 months
Professional Account
Full access
Corporate solution including all features.
* Prices do not include sales tax.
Statistics on World of wheat
Overview: grain and wheat
5
Leading producers
6
- Basic Statistic European Union-27: wheat production volume forecast 2016-2031
- Premium Statistic Wheat acreage in China 2011-2021
- Premium Statistic Wheat production in China 2012-2022
- Premium Statistic Net availability of wheat India FY 2015-2021
- Premium Statistic Wheat production volume in Russia 2011-2031
- Basic Statistic U.S. wheat supply 2010-2031
International trade
7
- Premium Statistic Wheat export volume worldwide 2014-2022
- Premium Statistic Major exporting countries of wheat, flour and products 2014-2022
- Premium Statistic Wheat, flour, and wheat products export volume in Ukraine 2014-2022
- Basic Statistic Wheat import dependence on Russia and Ukraine 2022, by country
- Premium Statistic Wheat import volume worldwide 2014/15-2021/22
- Basic Statistic Major importing countries of wheat flour and products 2014-2022
- Basic Statistic Durum wheat import dependence on Russia and Ukraine 2022, by country
Consumption
6
- Basic Statistic Global wheat consumption 2017/2018-2021/2022
- Premium Statistic Per capita food use of wheat worldwide 2000-2031
- Basic Statistic Global wheat consumption 2021/22, by country
- Basic Statistic European Union-27: wheat consumption volume forecast 2017-2031
- Premium Statistic Wheat consumption volume in Russia 2011-2031
- Premium Statistic U.S. per capita food use of wheat 2000-2031
Further related statistics
13
- Value of cereal production output in Scotland in 2019, by type
- Oats production volume in China 2011-2021
- Output value of cereals in Northern Ireland 2010-2021
- Milling products: UK export value 2021, by product
- Oats price per ton in Scotland 2003-2017
- Cereal production volume in the United Kingdom (UK) 2003-2021
- Agricultural area used for oats production in Norway 2008-2018
- Production of cereals in Vietnam from 2012 to 2021
- Human consumption of oats in Portugal between 2011/2012 and 2015/2016
- Wheat acreage in China 2021, by region
- Canada's domestic availability of cereals 2000-2019
- Canada's imports of cereals 2000-2018
- Number of new product launches containing oat rice in China 2020, by launch type
Further Content: You might find this interesting as well
Statistics
- Value of cereal production output in Scotland in 2019, by type
- Oats production volume in China 2011-2021
- Output value of cereals in Northern Ireland 2010-2021
- Milling products: UK export value 2021, by product
- Oats price per ton in Scotland 2003-2017
- Cereal production volume in the United Kingdom (UK) 2003-2021
- Agricultural area used for oats production in Norway 2008-2018
- Production of cereals in Vietnam from 2012 to 2021
- Human consumption of oats in Portugal between 2011/2012 and 2015/2016
- Wheat acreage in China 2021, by region
- Canada's domestic availability of cereals 2000-2019
- Canada's imports of cereals 2000-2018
- Number of new product launches containing oat rice in China 2020, by launch type
Scottish Government. (August 25, 2020). Annual output value of cereals produced in Scotland from 2003 to 2019* (in million GBP) [Graph]. In Statista. Retrieved February 05, 2023, from https://www.statista.com/statistics/521205/output-value-of-cereals-production-scotland/
Scottish Government. "Annual output value of cereals produced in Scotland from 2003 to 2019* (in million GBP)." Chart. August 25, 2020. Statista. Accessed February 05, 2023. https://www.statista.com/statistics/521205/output-value-of-cereals-production-scotland/
Scottish Government. (2020). Annual output value of cereals produced in Scotland from 2003 to 2019* (in million GBP). Statista. Statista Inc.. Accessed: February 05, 2023. https://www.statista.com/statistics/521205/output-value-of-cereals-production-scotland/
Scottish Government. "Annual Output Value of Cereals Produced in Scotland from 2003 to 2019* (in Million Gbp)." Statista, Statista Inc., 25 Aug 2020, https://www.statista.com/statistics/521205/output-value-of-cereals-production-scotland/
Scottish Government, Annual output value of cereals produced in Scotland from 2003 to 2019* (in million GBP) Statista, https://www.statista.com/statistics/521205/output-value-of-cereals-production-scotland/ (last visited February 05, 2023)
Annual output value of cereals produced in Scotland from 2003 to 2019* (in million GBP) [Graph], Scottish Government, August 25, 2020. [Online]. Available: https://www.statista.com/statistics/521205/output-value-of-cereals-production-scotland/