Agricultural crop production in Ukraine 2012-2023, by type
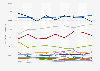
In 2023, Ukraine's production of grain and leguminous crops was approximately 60 million metric tons, roughly three times that of potatoes. All types of crops saw a decrease in production in 2022 when the Russia-Ukraine war began.