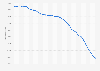
- Media & Advertising›
- Video Games & Gaming›
Share of U.S. consumers purchasing additional gaming content 2016, by type
Industry-specific and extensively researched technical data (partially from exclusive partnerships).
A paid subscription is required for full access.
Percentage of consumers who purchased additional video game content in the United States as of September 2016
Exclusive Premium Statistic

Share of respondents | |
---|---|
- | - |
- | - |
- | - |
Share of respondents | |
---|---|
- | - |
- | - |
- | - |
You need a Premium Account for unlimited access.
Full access to 1.5m statistics
Incl. source references
Available to download in PNG, PDF, XLS format
You need a Premium Account for unlimited access.
Full access to 1.5m statistics
Incl. source references
Available to download in PNG, PDF, XLS format
© Statista 2019
About this statistic
Show source
Please be patient - this may take a moment
Description
Source
More information
- Show sources information
- Show publisher information
- Release date
- October 2016
- Region
- United States
- Survey time period
- August 19 to September 2, 2016
- Number of respondents
- 8,893 respondents
- Age group
- 13-54 years
- Region
- United States
- Survey time period
- August 19 to September 2, 2016
- Number of respondents
- 8,893 respondents
- Age group
- 13-54 years


You only have access to basic statistics.
This statistic is not included in your account!
- Instant access to 1m statistics
- Download in XLS, PDF & PNG format
- Detailed references
$49 / Month *
Corporate solution including all features.
Prices do not include sales tax.


All Information
in one Presentation
- 74 page/s
- English
- pptx
- Detailed references
Everything On "Gaming monetization" in One Document: Edited and Divided into Handy Chapters. Including Detailed References.
I think of Statista as Google for researchers. Statista provides you with the information you search for right away.Dr. Horst Stipp
EVP, Research & Innovation, Advertising Research Foundation
- Overview
- PC and console games revenue worldwide from 2012 to 2022, by type (in billion U.S. dollars)Global PC and console games revenue 2012-2022, by type
- Revenue generated by free-to-play and pay-to-play massively multiplayer online (MMO) games worldwide as of June 2016, by region (in million U.S. dollars)F2P & P2P MMO games market value worldwide 2016, by region
- Distribution of digital games market revenue worldwide in 2017, by monetization model Distribution of digital games market revenue 2017, by monetization model
- Distribution of worldwide mobile application revenues in 2017, by channelShare of worldwide mobile app revenues 2017, by channel
- Percentage of consumers who purchased additional video game content in the United States as of September 2016Share of U.S. consumers purchasing additional gaming content 2016, by type
- Percentage of mobile users making in-game purchases on a monthly basis worldwide as of May 2016, by platformShare of global mobile users making in-game purchases 2016, by platform
- Digital games industry revenue in the United States in 2016, by game category (in million U.S. dollars)Digital games industry revenue in the U.S. 2016, by category
- Share of free and paid mobile game apps on Google Play Store as of December 2016Share of mobile games on Google Play 2016, by monetization type
- Free games
- In-game consumer spending worldwide in 2015 and 2020 (in billion U.S. dollars)In-game consumer spending worldwide 2015-2020
- Free-to-play (F2P) PC games market revenue worldwide from 2012 to 2022 (in billion U.S. dollars)F2P PC games revenue worldwide 2012-2022
- Free-to-play (F2P) PC games revenue worldwide in 2016, by region (in billion U.S. dollars)Free-to-play (F2P) PC games revenue worldwide 2016, by region
- In-game mobile gaming revenue in the United States from 2013 to 2016 (in billion U.S. dollars)U.S. in-game mobile gaming revenue 2013-2016
- Percentage of freemium mobile gamers who made in-game purchases in February 2016, by number of purchasesNumber of in-game purchases made by freemium mobile gamers 2016
- Amount spent on in-game purchases according to gamers in the United States as of December 2016Amount spent on in-game purchases according to U.S. gamers 2016
- Leading free-to-play (F2P) massively multiplayer online (MMO) games worldwide in 2017, by revenue (in million U.S. dollars)Leading F2P MMO games worldwide 2017, by revenue
- Paid games
- Average annual expenditure on video games per consumer unit in the United States from 2011 to 2017, by type (in U.S. dollars)U.S. household expenditure on video games 2011-2017, by type
- Leading sources used to purchase or download video games according to gamers in the United States as of December 2016Leading locations for video game purchases in the U.S. 2016
- Leading mobile payment methods used by digital gamers to buy console game content worldwide in 2017Leading mobile payments methods used for console game content worldwide 2017
- Frequency of pre-ordering video games according to gamers in the United States as of December 2016Game pre-order frequency according to U.S. gamers 2016
- Number of paid PC games owned by gamers in the United States as of December 2016Paid PC games possession in the U.S. 2016
- Number of paid home console games owned by gamers in the United States as of December 2016Paid home console games possession in the U.S. 2016
- Number of paid smartphone or tablet games owned by gamers in the United States as of December 2016Paid mobile games possession in the U.S. 2016
- Leading paid game titles on Steam in 2017, by number of units sold (in 1,000s)Top paid games on Steam 2017, by unit sales
- Monetization
- Worldwide in-app advertising and app store revenues of mobile apps and games in 2015 and 2020 (in billion U.S. dollars)Global in-app advertising and app store revenues 2015 & 2020
- Mobile gaming app monetization methods used worldwide as of September 2017, by OSMobile games monetization methods usage worldwide 2017, by OS
- Most popular advertising software development kits (SDKs) used by Android gaming and non-gaming apps in 1st half 2017, by share of voiceTop advertising SDKs used by Android gaming and non-gaming apps 2017
- Distribution of mobile in-app advertising impressions worldwide between January and November 2017, by ad formatIn-app advertising impression share worldwide in 2017, by ad format
- Monthly average in-app purchase amount per gaming app user worldwide as of May 2016, by platform (in U.S. dollars)Monthly in-app gaming spend per user 2016, by platform
- Average annual in-game spending of mobile gamers in the United States in 2016, by game title (in U.S. dollars)Annual mobile in-game spending in the U.S. 2016, by game
- Share of mobile free to download game apps on Google Play Store as of December 2016, by monetization modelShare of free mobile games on Google Play 2016, by monetization model
- Number of Google Play games using selected monetization models as of December 2016Google Play games using selected monetization models 2016
- Share of Pokémon GO in-app spenders in the U.S. 2016, by age
- Share of Super Mario Run in-game buyers in the U.S. 2016, by generation
- Share of Super Mario Run in-game buyers in the U.S. 2016, by gender
- Share of Pokémon GO in-game buyers in the U.S. 2016, by gender
- Leading PokéCoin bundles in the U.S. 2016, by purchase rate
- Paid and free digital media consumption in the UK as of March 2018, by type
- Motivations for paying to consume digital content in the UK as of May 2018
- In-game spending among free-to-play gamers in France 2014
- Consumer spending on online games in Japan 2009-2016
- Share of paying gamers among mobile gamers worldwide in 2012
- Share of consumers who have paid for online video games in MENA countries 2016
- Digital content consumer spending in Japan 2009-2014
- Free-to-play games: reasons for not purchasing in-game content in France 2014
- Free-to-play games: reasons to make in-game purchases in France 2014
- Leading PokéCoin bundles in the U.S. 2016, by revenue share
- Share of Fortnite spending on in-game purchases of selected items in the U.S. in 2018
- Spending money on digital video content in Austria 2017
- In-game spending among players of fee-based games in France 2014
- Average gaming-related expenditures per gamer in Canada 2018, by type
- PC and console games revenue worldwide from 2012 to 2022, by type (in billion U.S. dollars)
- Distribution of worldwide mobile application revenues in 2017, by channel
- Leading mobile payment methods used by digital gamers to buy console game content worldwide in 2017
- Leading paid game titles on Steam in 2017, by number of units sold (in 1,000s)
- Worldwide in-app advertising and app store revenues of mobile apps and games in 2015 and 2020 (in billion U.S. dollars)
- Distribution of Pokémon GO in-app spenders in the United States as of July 2016, by age group
- Distribution of Super Mario Run in-app spenders in the United States as of December 2016, by generation
- Distribution of Super Mario Run in-app spenders in the United States as of December 2016, by gender
- Distribution of Pokémon GO in-app spenders in the United States as of December 2016, by gender
- Was the digital media content you consumed free or paid?
- What were your personal reasons for paying to consume digital media rather than using services where you could have got them for free?*
- Revenue generated by free-to-play and pay-to-play massively multiplayer online (MMO) games worldwide as of June 2016, by region (in million U.S. dollars)
- Distribution of digital games market revenue worldwide in 2017, by monetization model
- Percentage of consumers who purchased additional video game content in the United States as of September 2016
- Percentage of mobile users making in-game purchases on a monthly basis worldwide as of May 2016, by platform
- Digital games industry revenue in the United States in 2016, by game category (in million U.S. dollars)
- Share of free and paid mobile game apps on Google Play Store as of December 2016
- In-game consumer spending worldwide in 2015 and 2020 (in billion U.S. dollars)
- Free-to-play (F2P) PC games market revenue worldwide from 2012 to 2022 (in billion U.S. dollars)
- Free-to-play (F2P) PC games revenue worldwide in 2016, by region (in billion U.S. dollars)
- In-game mobile gaming revenue in the United States from 2013 to 2016 (in billion U.S. dollars)
- Percentage of freemium mobile gamers who made in-game purchases in February 2016, by number of purchases
- Amount spent on in-game purchases according to gamers in the United States as of December 2016
- Leading free-to-play (F2P) massively multiplayer online (MMO) games worldwide in 2017, by revenue (in million U.S. dollars)
- Average annual expenditure on video games per consumer unit in the United States from 2011 to 2017, by type (in U.S. dollars)
- Leading sources used to purchase or download video games according to gamers in the United States as of December 2016
- Frequency of pre-ordering video games according to gamers in the United States as of December 2016
- Number of paid PC games owned by gamers in the United States as of December 2016
- Number of paid home console games owned by gamers in the United States as of December 2016
- Number of paid smartphone or tablet games owned by gamers in the United States as of December 2016
- Mobile gaming app monetization methods used worldwide as of September 2017, by OS
- Most popular advertising software development kits (SDKs) used by Android gaming and non-gaming apps in 1st half 2017, by share of voice
- Distribution of mobile in-app advertising impressions worldwide between January and November 2017, by ad format
- Monthly average in-app purchase amount per gaming app user worldwide as of May 2016, by platform (in U.S. dollars)
- Average annual in-game spending of mobile gamers in the United States in 2016, by game title (in U.S. dollars)
- Share of mobile free to download game apps on Google Play Store as of December 2016, by monetization model
- Number of Google Play games using selected monetization models as of December 2016
- Distribution of Android and iOS top grossing games in the United States as of August 2016, by ad content
- Distribution of the PokéCoin in-app purchases in the United States as of July 2016, by PokéCoin bundle
- Distribution of free-to-play gamers in France in 2014, by in-game spending in the last twelve months
- Consumer expenditure on online distribution of games in Japan from 2009 to 2016 (in billion Japanese yen)
- Share of paying gamers among mobile gamers in selected countries worldwide in 2012
- Percentage of consumers who have paid for online video games in selected countries in the Middle East and North Africa (MENA) region in 2016
- Total consumer expenditure on online content in Japan from 2009 to 2014 (in billion Japanese Yen)
- Reasons free-to-play gamers did not make in-game purchases in France in 2014
- Reasons for making an in-game purchase among free-to-play gamers in France in 2014
- Distribution of the PokéCoin in-app sales revenue in the United States as of July 2016, by PokéCoin bundle
- Share of spending on in-game purchases of selected items in Fortnite the United States as of June 2018
- Have you spent money on digital video content in the past 12 months?
- Distribution of fee-based digital game players in France in 2014, by in-game spending in the last twelve months*
- Average amount gamers spent on gaming and related content in Canada as of March 2018, by type (in U.S. dollars)
Statista offers dossiers and reports on over 170 industries. With Statista you are always able to make informed decisions and boost your work efficiency.
Internet & Telecommunications
- Social Media
- E-Commerce
- Online Video & Entertainment
- Advertising & Marketing
Consumer Goods & FMCG
- Alcoholic Beverages
- Cleaning Products
- Cosmetics & Personal Care
- Food & Nutrition
Retail & Trade
- Health & Hygiene
- International Trade
- Shopping Behavior
- Sports & Leisure
Travel, Tourism & Hospitality
- Business Travel
- Leisure Travel
- Accomodation
- Restaurants
Society
- Demographics
- Economy
- Education & Science
- Politics & Government
Transportation & Logistics
- Aviation
- Rail Transport
- Vehicles & Road Traffic
- Water Transport
You can only download this statistic as a Premium user.
As a Premium user you get access to the detailed source references and background information about this statistic.
As a Premium user you get access to background information and details about the release of this statistic.
As soon as this statistic is updated, you will immediately be notified via e-mail.
You need at least a Premium Account to use this feature.
This feature is limited to our corporate solutions.
Please contact us to get started with full access to dossiers, forecasts, studies and international data.

Updates on eCommerce, Digital Media, eTravel, eServices and more
- Market figures for 2018 to 2023
- Company and startup profiles
- User demographics

U.S. coal production has steadily declined in the past decade, but has been in the news in recent years due to President Trump's desire to revitalize the industry. This document provides an overview of the key figures, leading companies, and the employment trends in the U.S. coal mining industry.

This new export feature offers
- Structured graphical representation of the data
- Tailored target group analysis
- Option for further processing

The Polish e-commerce market is one of the fastest developing e-commerce markets in Europe. The latest data for Poland is presented in this dossier.

Plastic waste is an issue of global concern. Since China banned the import of recycled plastic, the U.S. has had to make adjustments to its management of plastic waste. This dossier provides an overview of plastic waste in the U.S.

This dossier provides an overview of hedge funds worldwide. Global hedge fund assets, performance, investors, and other topics are highlighted.

The Outdoor Advertising Association of America covers amongst others
- Number of billboards
- Outdoor advertising revenue
- Number of out-of-home displays

Find data, perceptions & more about
- Economic consequences
- Impact on the labor market
- A second referendum

Understand the recent developments in the Spanish eCommerce market!
- URL-related revenues
- Relevant online store KPIs
- eCommerce-related contacts

- Extended statistical dossier
- Insights, explanations & interpretations
- Challenges of the digital future

eCommerce is rapidly becoming a part of the Latin American shopping culture. The dossier includes data on
- Regional online shopping events
- Events by country

The outline of potential impacts of Brexit on UK industries has been updated in the UK Industry Reports.

Italian enterprises invest significantly in digital marketing. Find out about
- Relevant aspects & KPIs
- New trends
- Different strategies

Statista European Football Benchmark
- The big 5 European leagues
- All about the clubs & fans
- Sponsors & how they fit in

What are online shoppers' payment preferences around the world?
- Data on all payment methods
- Analysis for 50 countries
- Forecasts up to 2023

The kingdom of Saudi Arabia has faced political challenges.
- Perceptions & trade information
- Conflicts with Yemen, Iran, Qatar & Turkey
We use cookies to personalize contents and ads, offer social media features, and analyze access to our website. In your browser settings you can configure or disable this, respectively, and can delete any already placed cookies. For details, please see your browser’s Help section (by pressing F1). Please see our privacy statement for details about how we use data.