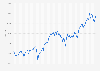
Last week's steep stock market sell-off, led by AI and technology stocks in the wake of Democrats' triumph at the midterms, was another reminder of how nervous investors currently are with respect to the staying power of the AI boom. Fears that Democrats might slow the datacenter buildout were enough to trigger the largest selloff since Trump's Liberation Day tariff announcement in April 2025, wiping out roughly $3 trillion in market capitalization. It was just the latest example in a series of setbacks, all triggered by headlines, statements or results questioning the sustainability of the current AI spending spree. While investors enjoyed the ride so far, with tech and AI stocks carrying markets to unprecedented highs, there is widespread fears that current valuations are too high and that the bubble might eventually burst, like the dot-com bubble did in 2000.
One way of looking at stock valuations is the so-called "Buffett Indicator", i.e. the market value of all publicly traded companies as a percentage of GDP. In a Fortune essay in 2001, Buffett described this metric as "the best single measure of where valuations stand at any given moment," not without acknowledging that, like any other metric, it has its limitations. During the dot-com boom, the Buffett Indicator rose to unprecedented highs, a fact that should have been "a very strong warning sigh," according to Buffett. "If the percentage relationship falls to the 70 percent or 80 percent area, buying stocks is likely to work very well for you," the legendary investor wrote. "If the ratio approaches 200 percent - as it did in 1999 and a part of 2000 - you are playing with fire."
As our chart shows, the ratio of market capitalization (as measured here by the Wilshire 5000 index) to GDP is significantly higher now than it was shortly before the dot-com bubble burst in 2000. In Q3 2026, the Buffett Indicator reached 225 percent, fueling fears that the AI boom could be another could be another bubble that is about to burst.