Skip to main content
Consumer Goods & FMCG
E-Commerce
Economy & Politics
Energy & Environment
Health, Pharma & Medtech
Internet
Media
Technology & Telecommunications
Transportation & Logistics
Travel, Tourism & Hospitality
View all industries
Global data volume growth
Global AI market size
Number of generative AI users worldwide
Global inflation rate
Retail e-commerce sales worldwide
Largest economies worldwide
Biggest social media platforms by users
Global EV market share by manufacturer
International tourist arrivals by world region
Global annual CO₂ emissions
Browse recent statistics
Artificial intelligence (AI) worldwide
TikTok
Nvidia
E-commerce worldwide
Global GDP
Instagram
Apparel market worldwide
Video gaming worldwide
Global renewable energy industry
Influencer marketing worldwide
Browse recent topics
Consumer Trends 2026
Artificial Intelligence: in-depth market analysis
E-commerce challenges
Global economy
TikTok
Luxury goods: in-depth market analysis
Electric vehicles: A global overview
Video gaming worldwide
Travel and tourism trends 2026
Battery recycling worldwide
Browse recent reports
Explore the tool
Explore Classic mode
Advertising & Media
eCommerce
Consumer
Finance
Global Indicators
Health
Industrial
Mobility
Technology
Explore Market Insights
eCommerce Insights
Research AI
Book a demo
All integrations
Developer docs
Explore Statista Connect
Research
Strategy & Consulting
Marketing
Media & PR
Explore AI assistants
Marketing
Research & Development
Strategy
Sales
Find the fact
Tell the story
Win the pitch
Understand the market
Develop your strategy
Academia
Agencies
Consultancies
Consumer goods
Finance
Tech
Research solutions
Strategy consulting
Communication services
Explore Statista+
Statista R
Statista Healthcare
About Statista
First steps & help center
Webinar & training hub
Success stories
Individuals & Small Teams
Businesses & Enterprises
Academia & Government
English
Deutsch
Daily Data
Infographics on the topic "black friday"
Black Friday
Nov 22, 2023
This chart shows the share of respondents who selected the following options as the main reason for shopping on the Black Friday weekend.
More Information
Black Friday
Nov 20, 2023
This chart shows the share of respondents who plan on buying something in the following categories on Black Friday and Cyber Monday.
More Information
Singles' Day
Nov 13, 2023
This chart shows the share of respondents in selected countries who know Black Friday/Cyber Monday/Singles' Day at least a little.
More Information
Singles' Day
Nov 10, 2023
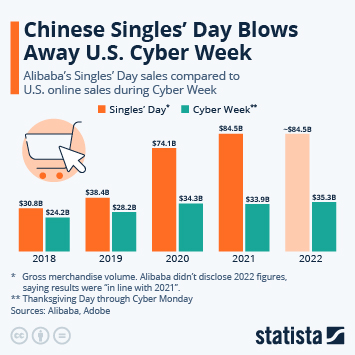
This chart shows how Alibaba's gross merchandise volume on Singles' Day compares to U.S. e-commerce sales on Thanksgiving weekend.
More Information
E-Commerce
Jul 11, 2023
This chart shows the estimated share of global e-commerce revenue by segment.
More Information
Amazon Prime Day
Jul 11, 2023
This chart shows Amazon's estimated Prime Day revenues since 2015.
More Information
E-Commerce
Nov 28, 2022
This chart shows estimated online holiday season spending in the United States in 2022, by event.
More Information
Singles' Day
Nov 14, 2022
This chart shows the gross merchandise volume for Alibaba on Singles' Day in China (in billion U.S. dollars).
More Information
Economy
Sep 30, 2022
This chart shows the exchange rate of GBP to USD.
More Information
Black Friday
Nov 25, 2021
This chart shows when U.S. shoppers plan to hit the stores on Black Friday this year.
More Information
Holiday Shopping Channels
Nov 25, 2021
This chart shows how Americans expect to spend their holiday budget across different channels.
More Information
Retail
Nov 24, 2021
This chart shows the results of a UK price tracking analysis for products advertised as 'Black Friday deals' in 2020.
More Information
Christmas Gifts
Nov 18, 2021
This chart shows Christmas gift plans and preferences for 2021.
More Information
Video Games
Nov 25, 2020
This chart shows monthly video game industry sales in the United States.
More Information
Holiday Shopping
Nov 24, 2020
This chart shows when Americans expect to do their holiday shopping this year.
More Information
Retail
Nov 23, 2020
This chart shows forecast annual changes in Black Friday footfall in the UK in 2020, by retail destination.
More Information
Prime Day
Jul 17, 2019
This chart shows the estimated global Prime Day retailer participation on the Amazon platform by year.
More Information
Black Friday
Nov 21, 2018
This chart shows the store opening times for select retailers in the United States on Black Friday.
More Information
Retail
Nov 21, 2018
This chart presents key figures about Black Friday in the United Kingdom.
More Information
Black Friday
Nov 20, 2018
The average anticipated consumer-spend during Black Friday, by country.
More Information
Thanksgiving Retail
Nov 19, 2018
This chart shows the share of adults who support retailers keeping stores open on Thanksgiving.
More Information
Billionaires
Nov 28, 2017
This chart ranks the 10 richest individuals worldwide by their net worth in November 2017.
More Information
Black Friday
Nov 17, 2017
This chart shows the peak shopping hours in a store on Black Friday 2017.
More Information
Holiday shopping
Nov 10, 2017
This chart shows how many Americans plan to go shopping or shop online on Thanksgiving weekend.
More Information
Virtual Reality Shipment Forecast
Nov 30, 2016
This chart shows a forecast of 2016 VR headset shipments.
More Information
Thanksgiving Weekend
Nov 24, 2016
This chart shows the product categories most likely to be purchased spontaneously on Black Friday in the U.S. in 2016.
More Information
Holiday Season
Nov 24, 2016
This chart shows what U.S. holiday shoppers plan to buy this year.
More Information
Holiday shopping season
Nov 23, 2016
This chart shows the most important factors in choosing a retailer during the holiday season.
More Information
Thanksgiving
Nov 23, 2016
This chart shows Thanksgiving weekend e-commerce sales compared to average daily sales in the U.S.
More Information
Black Friday
Nov 22, 2016
This chart shows when Americans plan to do the majority of their holiday shopping.
More Information
2
/
3
Contact
Get in touch with us. We are happy to help.
Do you still have questions?
Feel free to contact us anytime using our
contact form
or visit our
FAQ page
.
Your contact to the Infographics Newsroom
Felix Richter
Data Journalist
felix.richter@statista.com
+49 (40) 284 841 557