Skip to main content
Consumer Goods & FMCG
E-Commerce
Economy & Politics
Energy & Environment
Health, Pharma & Medtech
Internet
Media
Technology & Telecommunications
Transportation & Logistics
Travel, Tourism & Hospitality
View all industries
Global data volume growth
Global AI market size
Number of generative AI users worldwide
Global inflation rate
Retail e-commerce sales worldwide
Largest economies worldwide
Biggest social media platforms by users
Global EV market share by manufacturer
International tourist arrivals by world region
Global annual CO₂ emissions
Browse recent statistics
Artificial intelligence (AI) worldwide
TikTok
Nvidia
E-commerce worldwide
Global GDP
Instagram
Apparel market worldwide
Video gaming worldwide
Global renewable energy industry
Influencer marketing worldwide
Browse recent topics
Consumer Trends 2026
Artificial Intelligence: in-depth market analysis
E-commerce challenges
Global economy
TikTok
Luxury goods: in-depth market analysis
Electric vehicles: A global overview
Video gaming worldwide
Travel and tourism trends 2026
Battery recycling worldwide
Browse recent reports
Explore the tool
Explore Classic mode
Advertising & Media
eCommerce
Consumer
Finance
Global Indicators
Health
Industrial
Mobility
Technology
Explore Market Insights
eCommerce Insights
Research AI
Book a demo
All integrations
Developer docs
Explore Statista Connect
Research
Strategy & Consulting
Marketing
Media & PR
Explore AI assistants
Marketing
Research & Development
Strategy
Sales
Find the fact
Tell the story
Win the pitch
Understand the market
Develop your strategy
Academia
Agencies
Consultancies
Consumer goods
Finance
Tech
Research solutions
Strategy consulting
Communication services
Explore Statista+
Statista R
Statista Healthcare
About Statista
First steps & help center
Webinar & training hub
Success stories
Individuals & Small Teams
Businesses & Enterprises
Academia & Government
English
Deutsch
Daily Data
Infographics on the topic "smartphones"
Apple
Jan 30, 2026
This chart shows the likelihood of iPhone users using other Apple devices compared to Android phone users.
More Information
Meta Platforms
Jan 29, 2026
This chart shows the annual operating loss of Meta's Reality Labs division.
More Information
Print Advertising
Nov 26, 2025
This chart shows estimated print advertising revenue in the United States.
More Information
Apple
Nov 3, 2025
This chart shows Apple's trailing-twelve-months services revenue.
More Information
Refurbished Products
Oct 13, 2025
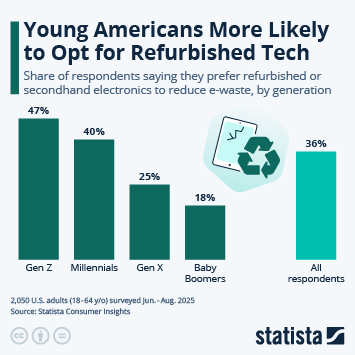
This chart shows how many U.S. consumers prefer refurbished electronics over new devices to reduce e-waste.
More Information
Social media ban
Oct 6, 2025
This chart shows the share of respondents who agree that children under 14 y/o should be banned from using social media (in percent).
More Information
Made in India
Sep 30, 2025
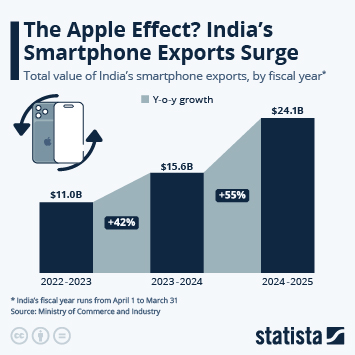
This chart shows India's smartphone exports from fiscal 2022/2023 to fiscal 2024/2025.
More Information
iPhone
Sep 15, 2025
This chart shows how many iOS versions past iPhone models have been compatible with.
More Information
Gaming
Aug 20, 2025
This chart shows the estimated sales in selected segments of the global games market (in billion U.S. dollars).
More Information
Apple iPhone
Aug 1, 2025
This chart shows the iPhone share in global smartphone shipments.
More Information
Supply chains
Aug 1, 2025
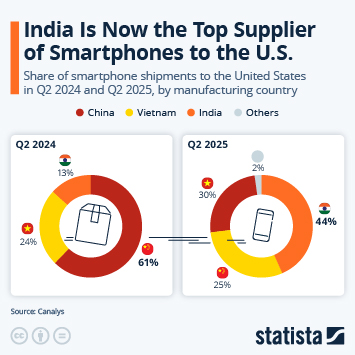
This chart shows the share of smartphone shipments to the United States in Q2 2024 and Q2 2025, by manufacturing country.
More Information
Children and technology
Jun 30, 2025
This chart shows which devices and online services U.S. parents wish had never been invented.
More Information
Values
Apr 29, 2025
This chart shows what Americans think are the most important values in life.
More Information
Manufacturing jobs in the U.S.
Apr 16, 2025
This chart shows the share of manufacturing jobs in total employment in the U.S.
More Information
Trade War
Apr 14, 2025
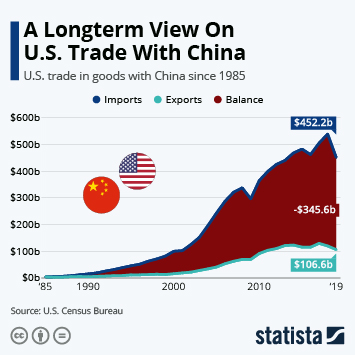
This chart shows the U.S. trade in goods with China since 1985.
More Information
Music Industry
Apr 11, 2025
This chart shows the best-selling vinyl albums in the United States in 2024.
More Information
Tablets vs. Smartphones
Apr 3, 2025
This chart compares how many consumers use smartphones and tablets in a selection of countries.
More Information
iPad
Apr 3, 2025
This chart shows the percentage of Apple's revenue that the iPad accounts for.
More Information
Amazon
Mar 28, 2025
Number of data points tracked by the following selection of smart home device app developers.
More Information
U.S. Trade
Mar 27, 2025
This chart shows the import value of the 10 most imported commodities to the United States in 2024.
More Information
Gaming
Mar 7, 2025
This chart shows the share of female respondents who regularly use PCs and game consoles to play video games.
More Information
TikTok
Jan 17, 2025
This chart shows the countries where TikTok is currently banned.
More Information
Consumer Electronics
Jan 7, 2025
This chart shows a forecast of U.S. consumer electronics retail sales.
More Information
Mental health
Dec 2, 2024
This chart shows the share of U.S. teenagers (12-17 y/o) who have experienced a major depressive episode in the past year.
More Information
Second-Hand Purchases
Nov 5, 2024
This chart shows how many Americans have made a second-hand purchase in the past 12 months in different product categories.
More Information
Desktop PCs
Oct 29, 2024
This chart shows the percentage of desktop PC owners in the U.S. who report using the following brand(s) in their household.
More Information
Online habits of adolescents
Sep 24, 2024
This chart shows the share of respondents who say they spend too much time online/on devices.
More Information
Cobalt
Sep 24, 2024
This chart shows the share of worldwide cobalt demand in 2023, by use.
More Information
AI
Sep 23, 2024
This chart shows the estimated cost of training selected AI models (in million U.S. dollars), by calculation model.
More Information
Online search
Sep 10, 2024
This chart shows the average annual market share of Google's search engine in the U.S.
More Information
2
/
8
Contact
Get in touch with us. We are happy to help.
Do you still have questions?
Feel free to contact us anytime using our
contact form
or visit our
FAQ page
.
Your contact to the Infographics Newsroom
Felix Richter
Data Journalist
felix.richter@statista.com
+49 (40) 284 841 557