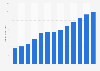
Poshmark is an online marketplace app for buying and selling fashion and luxury items. In the United States, the monthly number of downloads of the Poshmark app was greater on iOS-operated devices (such as iPhones and iPads) than Android devices. Only in the first two months of 2023, the Poshmark app registered about 1.8 million downloads, of which more than 1.2 million were from iOS devices.
Monthly downloads of the Poshmark app on iOS and Android devices in the United States from January 2017 to February 2023
Basic Account
Get to know the platform
You only have access to basic statistics.
This statistic is not included in your account.
Starter Account
The ideal entry-level account for individual users
- Instant access to 1m statistics
- Download in XLS, PDF & PNG format
- Detailed references
$59 USD $39 USD / Month *
in the first 12 months
Professional Account
Full access
Business Solutions including all features.
* Prices do not include sales tax.
Statistics on Fashion e-commerce in the United States
Overview
5
- Premium Statistic U.S. fashion and accessories e-retail revenue 2017-2027
- Premium Statistic U.S. fashion and accessories e-retail growth 2018-2027
- Premium Statistic U.S. fashion and accessories e-retail share 2017-2027
- Premium Statistic U.S. online shop and mail-order sales of clothing and clothing accessories 2003-2021
- Basic Statistic Total retail and e-commerce sales in the United States 2021, by business
Category benchmark
4
- Premium Statistic U.S. retail e-commerce sales CAGR 2017-2027, by product category
- Premium Statistic U.S. e-commerce annual sales growth 2022, by product category
- Premium Statistic Global online shopper per visit spend 2022, by category
- Basic Statistic E-commerce sales of U.S. electronic shopping and mail-order houses 2021
Leading players
6
- Premium Statistic United States: Top 10 Fashion online stores
- Basic Statistic Leading fashion e-commerce companies worldwide 2022, by market cap
- Premium Statistic CAGR of leading fashion e-commerce companies worldwide 2020-2022
- Premium Statistic Most popular clothing and footwear brands in the U.S. 2022
- Premium Statistic Leading fashion and apparel websites in the U.S. 2022, based on visit share
- Premium Statistic Leading fashion websites in the U.S. 2022, by share of voice
Consumption
8
- Premium Statistic Most frequent online channels for buying apparel and footwear U.S. 2022
- Premium Statistic Most popular online channels for apparel and footwear shopping U.S. 2022
- Premium Statistic Estimated annual spend on apparel and footwear online U.S. 2022
- Premium Statistic Online spending on apparel and footwear per year U.S. 2022, by income
- Premium Statistic Types of apparel and footwear bought online U.S. 2022, by type
- Premium Statistic Types of apparel and footwear consumers prefer to buy online vs. offline U.S. 2022
- Premium Statistic Share of online clothing shoppers who read ratings and reviews U.S. 2022
- Premium Statistic Share of online footwear shoppers who read ratings and reviews U.S. 2022
Apps
5
- Premium Statistic Most downloaded fashion & beauty apps in the U.S. 2022
- Premium Statistic SHEIN app: monthly downloads in the U.S. 2017-2022, by device
- Premium Statistic Poshmark app: monthly downloads in the U.S. 2017-2023, by device
- Premium Statistic GOAT app: monthly downloads in the U.S. 2017-2023, by device
- Premium Statistic Depop app: monthly downloads in the U.S. 2017-2022, by device
Spotlight: Resale
6
- Premium Statistic Reasons to purchase from online second-hand clothing stores in the U.S. 2022
- Premium Statistic Share of online second-hand clothing shoppers in the U.S. 2022
- Premium Statistic Share of online second-hand clothing shoppers in the U.S. 2022, by age group
- Premium Statistic Share of online second-hand clothing shoppers in the U.S. 2022, by income
- Premium Statistic Share of online second-hand clothing sellers in the U.S. 2022
- Premium Statistic TikTok users purchasing from online second-hand clothing stores in the U.S. 2022
Further related statistics
19
- Weekly Disney+ app monthly active users in Italy 2020
- Daily active users (DAU) of the Tik Tok app in Italy 2020
- Monthly active users of VSCO in the UK 2017-2020
- Forecast of smartphone user numbers in Austria 2018-2024
- Forecast of the smartphone user penetration rate in France 2018-2024
- Forecast of smartphone user numbers in Turkey 2015-2022
- Forecast of smartphone user numbers in Estonia 2015-2022
- Forecast of the smartphone user penetration rate in Hungary 2015-2025
- Forecast of smartphone user numbers in Lithuania 2015-2022
- Number of monthly active users of sports apps in China 2018
- Forecast of the smartphone user penetration rate in Romania 2015-2025
- Forecast of the smartphone user penetration rate in Germany 2018-2024
- Forecast of smartphone user numbers in Latvia 2015-2022
- Forecast of the smartphone user penetration rate in the UK 2018-2025
- Forecast of the smartphone user penetration rate in Portugal 2015-2022
- Global Duolingo Google Play DAU 2019-2021
- Forecast of the smartphone user penetration rate in Turkey 2018-2024
- Monthly active users of shared bike services in China 2019, by company
- Monthly active users of Zhuanzhuan app 2020-2021
Further Content: You might find this interesting as well
Statistics
- Weekly Disney+ app monthly active users in Italy 2020
- Daily active users (DAU) of the Tik Tok app in Italy 2020
- Monthly active users of VSCO in the UK 2017-2020
- Forecast of smartphone user numbers in Austria 2018-2024
- Forecast of the smartphone user penetration rate in France 2018-2024
- Forecast of smartphone user numbers in Turkey 2015-2022
- Forecast of smartphone user numbers in Estonia 2015-2022
- Forecast of the smartphone user penetration rate in Hungary 2015-2025
- Forecast of smartphone user numbers in Lithuania 2015-2022
- Number of monthly active users of sports apps in China 2018
- Forecast of the smartphone user penetration rate in Romania 2015-2025
- Forecast of the smartphone user penetration rate in Germany 2018-2024
- Forecast of smartphone user numbers in Latvia 2015-2022
- Forecast of the smartphone user penetration rate in the UK 2018-2025
- Forecast of the smartphone user penetration rate in Portugal 2015-2022
- Global Duolingo Google Play DAU 2019-2021
- Forecast of the smartphone user penetration rate in Turkey 2018-2024
- Monthly active users of shared bike services in China 2019, by company
- Monthly active users of Zhuanzhuan app 2020-2021
AppMagic. (March 20, 2023). Monthly downloads of the Poshmark app on iOS and Android devices in the United States from January 2017 to February 2023 [Graph]. In Statista. Retrieved March 31, 2023, from https://www.statista.com/statistics/1214237/monthly-poshmark-mau-in-the-us/
AppMagic. "Monthly downloads of the Poshmark app on iOS and Android devices in the United States from January 2017 to February 2023." Chart. March 20, 2023. Statista. Accessed March 31, 2023. https://www.statista.com/statistics/1214237/monthly-poshmark-mau-in-the-us/
AppMagic. (2023). Monthly downloads of the Poshmark app on iOS and Android devices in the United States from January 2017 to February 2023. Statista. Statista Inc.. Accessed: March 31, 2023. https://www.statista.com/statistics/1214237/monthly-poshmark-mau-in-the-us/
AppMagic. "Monthly Downloads of The Poshmark App on Ios and Android Devices in The United States from January 2017 to February 2023." Statista, Statista Inc., 20 Mar 2023, https://www.statista.com/statistics/1214237/monthly-poshmark-mau-in-the-us/
AppMagic, Monthly downloads of the Poshmark app on iOS and Android devices in the United States from January 2017 to February 2023 Statista, https://www.statista.com/statistics/1214237/monthly-poshmark-mau-in-the-us/ (last visited March 31, 2023)
Monthly downloads of the Poshmark app on iOS and Android devices in the United States from January 2017 to February 2023 [Graph], AppMagic, March 20, 2023. [Online]. Available: https://www.statista.com/statistics/1214237/monthly-poshmark-mau-in-the-us/