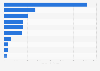
Polo Ralph Lauren's comparable e-commerce sales growth 2017-2023

Comparable digital commerce sales growth of Polo Ralph Lauren from 2017 to 2023

Download
Show detailed source information?
Register for free
Already a member?
Log in
Source

Use Ask Statista Research Service

Release date

May 2023

Region

Worldwide

Survey time period

2017 to 2023*

Supplementary notes

* Fiscal year 2023 ended April 1, 2023
Fiscal year 2022 ended April 2, 2022
Fiscal year 2021 ended March 27, 2021
Fiscal year 2020 ended March 28, 2020
Fiscal year 2019 ended March 30, 2019
Fiscal year 2018 ended March 31, 2018
Fiscal year 2017 ended April 1, 2017

Figures prior to fiscal year 2020 were taken from the previous publications of the source.

Citation formats
Statista Accounts: Access All Statistics. Starting from $2,388 USD / Year
Basic Account
Get to know the platform

You only have access to basic statistics.
This statistic is not included in your account.

Starter Account
The ideal entry-level account for individual users
  • Instant access to 1m statistics
  • Download in XLS, PDF & PNG format
  • Detailed references
$199 USD / Month *
Professional Account
Full access

Business Solutions including all features.

* Prices do not include sales tax.

Statistics on " Ralph Lauren "

Other statistics that may interest you Ralph Lauren

Market overview

7

Financial performance

8

Store information

6

Competitors

8

Further related statistics

14
Statista Accounts: Access All Statistics. Starting from $2,388 USD / Year
Learn more about how Statista can support your business.