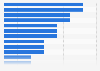
The average operating income of an NFL franchise was 108.63 million U.S. dollars in 2019 – an increase of over six million U.S. dollars on the previous year and a new record for the league overall. With an operating income of 425 million U.S. dollars, the Dallas Cowboys topped the list of all 32 NFL teams during the 2019 season.
Are NFL franchises set to get even more valuable?
The NFL has reached new heights in terms of average operating income, but figures are forecast to increase further over the next few years. The NFL and its teams are set to start talks with TV networks over broadcast deals expiring in 2021 and 2022, and the league has reasons to be optimistic about attracting more money. The competitiveness of the sports broadcasting market has increased significantly due to the arrival of modern streaming services, increasing the likelihood of a bidding war. Renegotiation talks also come as the average television viewership of the NFL regular season increased during 2018 following two years of falling figures.
Show me the money!
Operating income refers to how much of a team’s revenue will become profit after deducting operating expenses, such as wages. Across all the major sporting leagues worldwide, the NFL tops the rankings for total wage spend, paying out in the region of five billion U.S. dollars. The Jacksonville Jaguars are the NFL team that spends the most on player salaries: it paid its first-team players an average of 3.3 million U.S. dollars during the 2018 season.
National Football League: average operating income per franchise from 2002 to 2019
(in million U.S. dollars)
Profit from the additional features of your individual account
Currently, you are using a shared account. To use individual functions (e.g., mark statistics as favourites, set
statistic alerts) please log in with your personal account.
If you are an admin, please authenticate by logging in again.
Statista Accounts:
Access All Statistics. Starting from $468 / Year
Learn more about how Statista can support your business.
Forbes. (October 23, 2020). National Football League: average operating income per franchise from 2002 to 2019 (in million U.S. dollars) [Graph]. In Statista. Retrieved May 20, 2022, from https://www.statista.com/statistics/193482/nfl-franchises-average-operating-income-since-2005/
Forbes. "National Football League: average operating income per franchise from 2002 to 2019 (in million U.S. dollars)." Chart. October 23, 2020. Statista. Accessed May 20, 2022. https://www.statista.com/statistics/193482/nfl-franchises-average-operating-income-since-2005/
Forbes. (2020). National Football League: average operating income per franchise from 2002 to 2019 (in million U.S. dollars). Statista. Statista Inc.. Accessed: May 20, 2022. https://www.statista.com/statistics/193482/nfl-franchises-average-operating-income-since-2005/
Forbes. "National Football League: Average Operating Income per Franchise from 2002 to 2019 (in Million U.S. Dollars)." Statista, Statista Inc., 23 Oct 2020, https://www.statista.com/statistics/193482/nfl-franchises-average-operating-income-since-2005/
Forbes, National Football League: average operating income per franchise from 2002 to 2019 (in million U.S. dollars) Statista, https://www.statista.com/statistics/193482/nfl-franchises-average-operating-income-since-2005/ (last visited May 20, 2022)