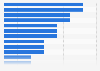
The average revenue multiple per franchise in the National Football League followed a generally increasing trend between 2006 and 2023. In 2023, the average revenue multiple of a National Football League franchise was 8.99.
National Football League average revenue multiple* per franchise from 2006 to 2023
Profit from the additional features of your individual account
Currently, you are using a shared account. To use individual functions (e.g., mark statistics as favourites, set
statistic alerts) please log in with your personal account.
If you are an admin, please authenticate by logging in again.
Learn more about how Statista can support your business.
Forbes. (August 29, 2024). National Football League average revenue multiple* per franchise from 2006 to 2023 [Graph]. In Statista. Retrieved October 06, 2024, from https://www.statista.com/statistics/193497/nfl-franchises-average-revenue-multiple-since-2005/
Forbes. "National Football League average revenue multiple* per franchise from 2006 to 2023." Chart. August 29, 2024. Statista. Accessed October 06, 2024. https://www.statista.com/statistics/193497/nfl-franchises-average-revenue-multiple-since-2005/
Forbes. (2024). National Football League average revenue multiple* per franchise from 2006 to 2023. Statista. Statista Inc.. Accessed: October 06, 2024. https://www.statista.com/statistics/193497/nfl-franchises-average-revenue-multiple-since-2005/
Forbes. "National Football League Average Revenue Multiple* per Franchise from 2006 to 2023." Statista, Statista Inc., 29 Aug 2024, https://www.statista.com/statistics/193497/nfl-franchises-average-revenue-multiple-since-2005/
Forbes, National Football League average revenue multiple* per franchise from 2006 to 2023 Statista, https://www.statista.com/statistics/193497/nfl-franchises-average-revenue-multiple-since-2005/ (last visited October 06, 2024)
National Football League average revenue multiple* per franchise from 2006 to 2023 [Graph], Forbes, August 29, 2024. [Online]. Available: https://www.statista.com/statistics/193497/nfl-franchises-average-revenue-multiple-since-2005/