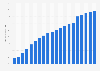
- Internet›
- Social Media & User-Generated Content›
Forms of community and connection enabled via online social media in 2011
Industry-specific and extensively researched technical data (partially from exclusive partnerships).
A paid subscription is required for full access.
Forms of community and connection enabled via online social media in 2011
Forms of community and connection enabled via online social media communication in 2011

Forms of community and connection enabled via online social media communication in 2011
Share of respondents | |
---|---|
- | - |
- | - |
- | - |
- | - |
Share of respondents | |
---|---|
- | - |
- | - |
- | - |
- | - |
You need a Premium Account for unlimited access.
Full access to 1m statistics
Incl. source references
Available to download in PNG, PDF, XLS format
You need a Premium Account for unlimited access.
Full access to 1m statistics
Incl. source references
Available to download in PNG, PDF, XLS format
© Statista 2019
About this statistic
Show source
Please be patient - this may take a moment
Description
Source
More information
- Show sources information
- Show publisher information
- Release date
- November 2011
- Region
- Worldwide
- Survey time period
- November 2011
- Supplementary notes
- The source does not state the age and total number of respondents.
Source
- Show sources information
- Show publisher information
- Release date
- November 2011
More information
- Region
- Worldwide
- Survey time period
- November 2011
- Supplementary notes
- The source does not state the age and total number of respondents.
Other statistics on the topic

Social Media & User-Generated Content
Share of U.S. population who use social media 2008-2019

Mobile Internet & Apps
Most popular social media apps in the U.S. 2019, by audience

Social Media & User-Generated Content
U.S. market share of leading social media websites 2019

Key Figures of E-Commerce
United States: retail e-commerce sales 2017-2023
You only have access to basic statistics.
This statistic is not included in your account!
- Instant access to 1m statistics
- Download in XLS, PDF & PNG format
- Detailed references
$59 / Month *
Corporate solution including all features.
Prices do not include sales tax.


I think of Statista as Google for researchers. Statista provides you with the information you search for right away.Dr. Horst Stipp
EVP, Research & Innovation, Advertising Research Foundation
- Online access and traffic
- Countries with the highest number of internet users as of March 2019 (in millions)Countries with the highest number of internet users 2019
- Countries with the highest internet penetration rate as of January 2019Leading online markets based on penetration rate 2019
- Number of fixed broadband subscriptions in the United States from 2000 to 2018 (in millions)Number of U.S. households with broadband internet access 2000-2018
- Mobile broadband subscriptions per 100 inhabitants in the United States from 2004 to 2017United States: mobile broadband subscriptions per 100 inhabitants 2004-2017
- Number of broadband internet subscribers in the United States from 2011 to 2019, by cable provider (in 1,000s)Broadband internet subscriber numbers in the U.S. 2011-2019, by cable provider
- Home broadband connection usage in the United States in 2018, by stateU.S. household broadband internet connection usage 2018, by state
- How do you mainly access the internet at home?Internet access by type in the U.S. 2019
- U.S. states with the highest average internet connection speed as of 3rd quarter 2018 (in Mbps)U.S. states with the fastest average internet speed 2018
- Online users
- Media audience size in the United States as of 2018, by medium (in millions)U.S. digital media audiences 2018, by medium
- Number of internet users in the United States from 2000 to 2019 (in millions)United States: number of internet users 2000-2019
- Number of internet users in the United States from 2017 to 2023 (in millions) United States: number of internet users 2017-2023
- Internet user penetration in the United States from 2017 to 2023United States internet usage penetration 2017-2023
- Percentage of population using the internet in the United States from 2000 to 2017United States internet penetration 2000-2017
- Number of unique visitors to leading mobile websites in the United States as of June 2017 (in millions)Most visited mobile websites in the United States 2017
- Number of unique visitors to leading desktop websites in the United States as of June 2017 (in millions)Most visited desktop websites in the United States 2017
- Share of adults in the United States who use the internet in 2019, by age groupU.S. internet usage penetration 2019, by age group
- Internet usage
- Adult internet usage penetration in the United States from 2000 to 2018, by age groupU.S. adult internet usage reach 2000-2018, by age group
- Adult internet usage penetration in the United States from 2000 to 2018, by genderU.S. adult internet usage reach 2000-2018, by gender
- Internet usage frequency of adults in the United States as of January 2018Frequency of internet usage by U.S. adults 2018
- Share of adults in the United States who are online almost constantly as of February 2019, by age groupU.S. adults who are online almost constantly 2019, by age
- Share of adults in the United States who are online almost constantly as of February 2019, by genderU.S. adults who are online almost constantly 2019, by gender
- Share of adults in the United States who are online almost constantly as of February 2019, by ethnicityU.S. adults who are online almost constantly 2019, by ethnicity
- Share of adults in the United States who are online almost constantly as of February 2019, by educational backgroundU.S. adults who are online almost constantly 2019, by education
- Share of adults in the United States who are online almost constantly as of February 2019, by incomeU.S. adults who are online almost constantly 2019, by income
- Mobile internet and apps
- Number of mobile phone internet users in the United States from 2017 to 2023 (in millions)United States: mobile phone internet users 2017-2023
- Mobile phone internet user penetration in the United States from 2017 to 2023United States: mobile phone internet user penetration 2017-2023
- Most popular activities on smartphones and tablets according to device owners in the United States as of May 2017Leading U.S. mobile activity reach on smartphone and tablets 2017
- Mobile audience reach of leading smartphone apps in the United States as of August 2019Reach of most popular U.S. smartphone apps 2019
- Leading iPhone apps in the Apple App Store in the United States in November 2019, by number of downloads (in millions)Leading iPhone apps in the U.S. 2019, by downloads
- Leading Android apps in the Google Play Store in the United States as of November 2019, by number of downloads (in millions)Leading Android apps in the U.S. 2019, by downloads
- Most popular mobile music and video apps in the United States as of September 2019, by monthly users (in millions)Most popular entertainment apps in the U.S. 2019, by audience
- Social media
- Share of internet users in the United States with accounts on selected social media platforms as of February 2018, by age groupU.S. social media account ownership 2018, by age group
- Mobile share of social media visits in the United States from 4th quarter 2017 to 3rd quarter 2019Mobile share of U.S. social media visits 2017-2019
- Percentage of U.S. population who currently use any social media from 2008 to 2019Share of U.S. population who use social media 2008-2019
- Leading social media websites in the United States in August 2019, based on share of visitsU.S. market share of leading social media websites 2019
- Year-on-year change in user engagement with selected social media apps in the United States as of December 2018U.S. mobile social app user engagement growth 2018
- On which of these topics have you expressed your opinion on the internet in the past 4 weeks (e.g. by liking an article on social media)?Products/topics talked about online in the U.S. 2019
- Most popular mobile social networking apps in the United States as of September 2019, by monthly users (in millions)Most popular social media apps in the U.S. 2019, by audience
- Most popular mobile social networking apps in the United States as of September 2019, by reachMost popular social media apps in the U.S. 2019, by reach
- Online and mobile commerce
- Retail e-commerce sales in the United States from 2017 to 2023 (in million U.S. dollars)United States: retail e-commerce sales 2017-2023
- Retail e-commerce sales including digital services in the United States from 2014 to 2023 (in billion U.S. dollars)United States: retail e-commerce sales 2014-2023
- Mobile retail e-commerce sales in the United States from 2013 to 2020 (in billion U.S. dollars)U.S. mobile retail commerce revenue 2013-2020
- Retail m-commerce sales via smartphone in the United States from 2018 to 2022 (in billion U.S. dollars)U.S. smartphone retail m-commerce revenue 2018-2022
- Number of digital buyers in the United States from 2017 to 2023 (in millions)United States: number of digital buyers 2017-2023
- Digital buyer penetration in the United States from 2017 to 2023United States: digital buyer penetration 2017-2023
- Channels used to purchase products according to internet users in the United States as of March 2019, by categoryU.S. leading shopping channels 2019, by category
- Most popular retail websites in the United States as of December 2018, ranked by visitors (in millions)Monthly unique visitors to U.S. retail websites 2018
- Internet users who regularly visit general information sites in the UK 2012, by age
- Regular leisure activities of children in Germany 2018
- Online entertainment and leisure content consumption in Great Britain 2011-2013
- Internet households with users who used online dating services on a tablet in the U.S. 201...
- Online videos: monthly usage in the UK in 2012, by gender
- U.S. internet users who accessed cable TV network sites on smartphone 2018, by age
- Most popular online activities among teenagers in Germany 2013, by age group
- Consumers who bought flowers on the internet in the U.S. 2018, by age
- U.S. internet users who used online medical services on a smartphone 2018, by age
- Internet users who accessed cable TV network sites in the U.S. 2018, by age
- Finding leisure-related information online in the UK 2014-2015, by age
- Internet users who engaged with fantasy sports in the U.S. 2018, by age
- Internet users who used online dating services in the U.S. 2018, by age
- Internet users who used online medical services in the U.S. 2018, by age
- Women who like to share their daily activities with others on social media in 2014
- Countries with the highest number of internet users 2019
- Leading online markets based on penetration rate 2019
- Number of U.S. households with broadband internet access 2000-2018
- United States: mobile broadband subscriptions per 100 inhabitants 2004-2017
- Broadband internet subscriber numbers in the U.S. 2011-2019, by cable provider
- U.S. household broadband internet connection usage 2018, by state
- Internet access by type in the U.S. 2019
- U.S. states with the fastest average internet speed 2018
- Average fixed download and upload speeds in the U.S. Q3 2018, by city
- Share of U.S. mobile website traffic 2015-2019
- Freedom House Index: internet freedom in selected countries 2019
- U.S. digital media audiences 2018, by medium
- United States: number of internet users 2000-2019
- United States: number of internet users 2017-2023
- United States internet usage penetration 2017-2023
- United States internet penetration 2000-2017
- Most visited mobile websites in the United States 2017
- Most visited desktop websites in the United States 2017
- U.S. internet usage penetration 2019, by age group
- U.S. internet usage penetration 2019, by gender
- U.S. internet usage penetration 2019, by education
- U.S. internet usage penetration 2019, by household income
- U.S. internet usage penetration 2019, by ethnicity
- U.S. internet usage penetration 2019, by urbanity
- Offline population of the U.S. 2000-2019
- U.S. adults who do not use the internet 2019, by age
- U.S. adult internet usage reach 2000-2018, by age group
- U.S. adult internet usage reach 2000-2018, by gender
- Frequency of internet usage by U.S. adults 2018
- U.S. adults who are online almost constantly 2019, by age
- U.S. adults who are online almost constantly 2019, by gender
- U.S. adults who are online almost constantly 2019, by ethnicity
- U.S. adults who are online almost constantly 2019, by education
- U.S. adults who are online almost constantly 2019, by income
- Website and online service usage by type in the U.S. 2019
- Most visited multi-platform U.S. web properties 2019
- Leading U.S. video properties 2019, by unique viewers
- U.S. adult opinions regarding the internet & its effect on areas of life 2019
- U.S. adults who could live without the internet 2019
- U.S. adults who regard internet access as a human right 2019
- Digital decluttering actions of U.S. online users 2019
- United States: mobile phone internet users 2017-2023
- United States: mobile phone internet user penetration 2017-2023
- Leading U.S. mobile activity reach on smartphone and tablets 2017
- Reach of most popular U.S. smartphone apps 2019
- Leading iPhone apps in the U.S. 2019, by downloads
- Leading Android apps in the U.S. 2019, by downloads
- Most popular entertainment apps in the U.S. 2019, by audience
- U.S. social media account ownership 2018, by age group
- Mobile share of U.S. social media visits 2017-2019
- Share of U.S. population who use social media 2008-2019
- U.S. market share of leading social media websites 2019
- U.S. mobile social app user engagement growth 2018
- Products/topics talked about online in the U.S. 2019
- Most popular social media apps in the U.S. 2019, by audience
- Most popular social media apps in the U.S. 2019, by reach
- Leading mobile messengers in the U.S. 2019, by users
- Leading mobile messengers in the U.S. 2019, by reach
- Favorite social networks of U.S. teens 2012-2019
- Trustworthiness of social media sites according to U.S. adults 2018, by gender
- U.S. adults who have shared an opinion piece on social media 2018, by age
- U.S. adults unfollowing social media accounts due to an opinion piece 2018
- US. user age when they first opened a social media account 2018
- United States: retail e-commerce sales 2017-2023
- United States: retail e-commerce sales 2014-2023
- U.S. mobile retail commerce revenue 2013-2020
- U.S. smartphone retail m-commerce revenue 2018-2022
- United States: number of digital buyers 2017-2023
- United States: digital buyer penetration 2017-2023
- U.S. leading shopping channels 2019, by category
- Monthly unique visitors to U.S. retail websites 2018
- Most popular e-commerce apps in the U.S. 2019, by audience
- Most popular e-commerce apps in the U.S. 2019, by reach
- U.S. online shopper conversion rate 2019, by device
- U.S. average online shopping order value 2019, by device
- Internet users who regularly visit general information sites in the UK 2012, by age
- Regular leisure activities of children in Germany 2018
- Online entertainment and leisure content consumption in Great Britain 2011-2013
- Internet households with users who used online dating services on a tablet in the U.S. 2018 to 2020
- Online videos: monthly usage in the UK in 2012, by gender
- U.S. internet users who accessed cable TV network sites on smartphone 2018, by age
- Most popular online activities among teenagers in Germany 2013, by age group
- Consumers who bought flowers on the internet in the U.S. 2018, by age
- U.S. internet users who used online medical services on a smartphone 2018, by age
- Internet users who accessed cable TV network sites in the U.S. 2018, by age
- Finding leisure-related information online in the UK 2014-2015, by age
- Internet users who engaged with fantasy sports in the U.S. 2018, by age
- Internet users who used online dating services in the U.S. 2018, by age
- Internet users who used online medical services in the U.S. 2018, by age
- Women who like to share their daily activities with others on social media in 2014
Statista offers dossiers and reports on over 170 industries. With Statista you are always able to make informed decisions and boost your work efficiency.
- Social Media
- E-Commerce
- Online Video & Entertainment
- Advertising & Marketing
- Alcoholic Beverages
- Cleaning Products
- Cosmetics & Personal Care
- Food & Nutrition
- Health & Hygiene
- International Trade
- Shopping Behavior
- Sports & Leisure
- Business Travel
- Leisure Travel
- Accomodation
- Restaurants
- Demographics
- Economy
- Education & Science
- Politics & Government
- Aviation
- Rail Transport
- Vehicles & Road Traffic
- Water Transport
You can only download this statistic as a Premium user.
As a Premium user you get access to the detailed source references and background information about this statistic.
As a Premium user you get access to background information and details about the release of this statistic.
As soon as this statistic is updated, you will immediately be notified via e-mail.
...and make my research life easier.
You need at least a Premium Account to use this feature.
This feature is limited to our corporate solutions.
Please contact us to get started with full access to dossiers, forecasts, studies and international data.
We use cookies to personalize contents and ads, offer social media features, and analyze access to our website. In your browser settings you can configure or disable this, respectively, and can delete any already placed cookies. For details, please see your browser’s Help section (by pressing F1). Please see our privacy statement for details about how we use data.