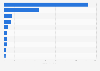
Consumption of dry pancake and waffle mixes (store bought) in the U.S. 2020
This statistic shows the usage of dry pancake and waffle mixes (store bought) in the United States in 2020. The data has been calculated by Statista based on the U.S. Census data and Simmons National Consumer Survey (NHCS). According to this statistic, 207.49 million Americans used dry pancake and waffle mixes (store bought) in 2020.