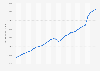
Despite some fluctuations, sales volume in department and other non-specialized, non-food stores in Great Britain increased overall between January 2015 and May 2018. From June 2018 onwards, monthly sales volume in these type of retail stores started to decrease, plunging in April and May 2020, and again in January and December 2021, most possibly due to the coronavirus outbreak and related lockdowns. As of January 2023, department store sales volume index stood at 89.3 points.
Monthly volume of sales in non-specialized stores in Great Britain from January 2015 to January 2023, by index number of sales per week
* Figures are seasonally adjusted, chained volume of sales in non-specialized predominantly non-food stores (e.g. department stores). Retail sales only cover goods, not services. Index 2019 = 100
Profit from the additional features of your individual account
Currently, you are using a shared account. To use individual functions (e.g., mark statistics as favourites, set
statistic alerts) please log in with your personal account.
If you are an admin, please authenticate by logging in again.
Learn more about how Statista can support your business.
Office for National Statistics (UK). (February 17, 2023). Monthly volume of sales in non-specialized stores in Great Britain from January 2015 to January 2023, by index number of sales per week [Graph]. In Statista. Retrieved September 20, 2024, from https://www.statista.com/statistics/287080/department-non-specialised-retail-store-sales-volume-monthly-index-in-great-britain/
Office for National Statistics (UK). "Monthly volume of sales in non-specialized stores in Great Britain from January 2015 to January 2023, by index number of sales per week." Chart. February 17, 2023. Statista. Accessed September 20, 2024. https://www.statista.com/statistics/287080/department-non-specialised-retail-store-sales-volume-monthly-index-in-great-britain/
Office for National Statistics (UK). (2023). Monthly volume of sales in non-specialized stores in Great Britain from January 2015 to January 2023, by index number of sales per week. Statista. Statista Inc.. Accessed: September 20, 2024. https://www.statista.com/statistics/287080/department-non-specialised-retail-store-sales-volume-monthly-index-in-great-britain/
Office for National Statistics (UK). "Monthly Volume of Sales in Non-specialized Stores in Great Britain from January 2015 to January 2023, by Index Number of Sales per Week." Statista, Statista Inc., 17 Feb 2023, https://www.statista.com/statistics/287080/department-non-specialised-retail-store-sales-volume-monthly-index-in-great-britain/
Office for National Statistics (UK), Monthly volume of sales in non-specialized stores in Great Britain from January 2015 to January 2023, by index number of sales per week Statista, https://www.statista.com/statistics/287080/department-non-specialised-retail-store-sales-volume-monthly-index-in-great-britain/ (last visited September 20, 2024)
Monthly volume of sales in non-specialized stores in Great Britain from January 2015 to January 2023, by index number of sales per week [Graph], Office for National Statistics (UK), February 17, 2023. [Online]. Available: https://www.statista.com/statistics/287080/department-non-specialised-retail-store-sales-volume-monthly-index-in-great-britain/