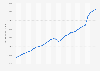
The department store chain Nordstrom invested 300 million U.S. dollars in advertising worldwide in 2021. In contrast, Macy's, the leading department store chain in the United States based on sales, spent 818 million U.S. dollars in
Nordstrom Inc. advertising expenses worldwide from 2014 to 2021 (in million U.S. dollars)
Loading statistic...
Basic Account
Get to know the platform
You only have access to basic statistics.
Starter Account
The ideal entry-level account for individual users
- Instant access to 1m statistics
- Download in XLS, PDF & PNG format
- Detailed references
$59 USD $39 USD / Month *
in the first 12 months
Professional Account
Full access
Business Solutions including all features.
* Prices do not include sales tax.
Statistics on Department stores in the U.S.
Industry overview
5
- Premium Statistic World: department stores market size 2021-2026
- Premium Statistic United States: annual retail industry sales 2002-2022
- Premium Statistic United States: department store sales 1992-2021
- Premium Statistic United States: department store monthly sales 2017-2022
- Premium Statistic United States: department store bankruptcies 2017-2020
Sales of leading companies
7
- Basic Statistic Macy's: net sales worldwide 2005-2021
- Premium Statistic Kohl's: net sales 2010-2021
- Basic Statistic Global net sales of Nordstrom from 2011 to 2022
- Basic Statistic Dillard's: global net sales 2012-2021
- Premium Statistic United States: sales per square foot department stores 2021
- Premium Statistic United States: sales per store of top department stores 2021
- Premium Statistic United States: e-commerce sales of U.S. department stores 2020
Store numbers
5
- Premium Statistic United States: number of department stores 2015-2025
- Basic Statistic Macy's: number of stores globally 2015-2021, by brand
- Premium Statistic Kohl's: number of stores 2010-2021
- Basic Statistic Number of stores of Nordstrom worldwide 2013-2022
- Basic Statistic Dillard's: number of stores in the U.S. 2012-2021
Advertising spending
4
Consumer behavior
5
- Premium Statistic Leading department stores in the U.S. Q1 2022, by consumer loyalty score
- Premium Statistic United States: consumer satisfaction selected department and discount stores 2023
- Premium Statistic Average spend on department store gift cards in the United States 2021
- Premium Statistic Breakdown of U.S. consumers' closets as of 2011-2031, by purchase channel
- Premium Statistic United States: share of consumers spending more or less in fashion, by channel 2022
Further related statistics
19
- Lowe's: ad spend in the U.S. 2012-2019
- J.C.Penney: ad spend in the U.S. 2012-2019
- Absolut: ad spend in the U.S. 2014-2019
- Svedka: ad spend in the U.S. 2014-2019
- Ketel One: ad spend in the U.S. 2014-2019
- Sobieski: ad spend in the U.S. 2014-2019
- Brazil: ad spend in media 2016-2018
- Ad spend in Peru 2019-2023
- Leading advertising categories in the U.S. in 2018
- eBay: ad spend in the U.S. 2012-2019
- Change in advertising spending in the U.S. 2016, by medium
- Volkswagen: ad spend worldwide 2020-2021
- Brazil: food advertising spending 2016-2018
- National TV ad spend during NBA post-season 2014-2017
- Brazil: car advertising spending 2016-2018
- Cinema advertising spending change in Malaysia 2008-2015
- U.S. Nordstrom fashion sales GMV 2015-2020
- Department stores furniture sales revenue in Japan 2013-2021
- Influential factors for buying premium goods Vietnam 2018
Further Content: You might find this interesting as well
Statistics
- Lowe's: ad spend in the U.S. 2012-2019
- J.C.Penney: ad spend in the U.S. 2012-2019
- Absolut: ad spend in the U.S. 2014-2019
- Svedka: ad spend in the U.S. 2014-2019
- Ketel One: ad spend in the U.S. 2014-2019
- Sobieski: ad spend in the U.S. 2014-2019
- Brazil: ad spend in media 2016-2018
- Ad spend in Peru 2019-2023
- Leading advertising categories in the U.S. in 2018
- eBay: ad spend in the U.S. 2012-2019
- Change in advertising spending in the U.S. 2016, by medium
- Volkswagen: ad spend worldwide 2020-2021
- Brazil: food advertising spending 2016-2018
- National TV ad spend during NBA post-season 2014-2017
- Brazil: car advertising spending 2016-2018
- Cinema advertising spending change in Malaysia 2008-2015
- U.S. Nordstrom fashion sales GMV 2015-2020
- Department stores furniture sales revenue in Japan 2013-2021
- Influential factors for buying premium goods Vietnam 2018
Nordstrom. (March 11, 2022). Nordstrom Inc. advertising expenses worldwide from 2014 to 2021 (in million U.S. dollars) [Graph]. In Statista. Retrieved March 24, 2023, from https://www.statista.com/statistics/751409/nordstrom-corp-ad-spending-usa/
Nordstrom. "Nordstrom Inc. advertising expenses worldwide from 2014 to 2021 (in million U.S. dollars) ." Chart. March 11, 2022. Statista. Accessed March 24, 2023. https://www.statista.com/statistics/751409/nordstrom-corp-ad-spending-usa/
Nordstrom. (2022). Nordstrom Inc. advertising expenses worldwide from 2014 to 2021 (in million U.S. dollars) . Statista. Statista Inc.. Accessed: March 24, 2023. https://www.statista.com/statistics/751409/nordstrom-corp-ad-spending-usa/
Nordstrom. "Nordstrom Inc. Advertising Expenses Worldwide from 2014 to 2021 (in Million U.S. Dollars) ." Statista, Statista Inc., 11 Mar 2022, https://www.statista.com/statistics/751409/nordstrom-corp-ad-spending-usa/
Nordstrom, Nordstrom Inc. advertising expenses worldwide from 2014 to 2021 (in million U.S. dollars) Statista, https://www.statista.com/statistics/751409/nordstrom-corp-ad-spending-usa/ (last visited March 24, 2023)
Nordstrom Inc. advertising expenses worldwide from 2014 to 2021 (in million U.S. dollars) [Graph], Nordstrom, March 11, 2022. [Online]. Available: https://www.statista.com/statistics/751409/nordstrom-corp-ad-spending-usa/