
- Internet›
- Demographics & Use›
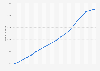
Global opinion on online governance through the UN 2014, by country
Share of global internet users who would trust the United Nations to play an important role in running the internet as of November 2014, by country

Share of respondents | |
---|---|
Total | 50% |
India | 72% |
Nigeria | 69% |
Indonesia | 66% |
Hong Kong | 64% |
Kenya | 63% |
Poland | 60% |
Mexico | 59% |
Pakistan | 59% |
China | 57% |
Sweden | 56% |
Egypt | 54% |
South Korea | 54% |
Brazil | 47% |
South Africa | 47% |
France | 43% |
Italy | 43% |
Tunisia | 42% |
Australia | 40% |
Great Britain | 39% |
Canada | 38% |
Turkey | 37% |
United States | 33% |
Japan | 30% |
Germany | 27% |
© Statista 2019
About this statistic
Show source
Please be patient - this may take a moment
Description
Source
More information
- Show sources information
- Show publisher information
- Release date
- November 2014
- Region
- Worldwide
- Survey time period
- October 7, 2014 to November 12, 2014
- Number of respondents
- 23,376 respondents (about 1,000 in each country)
- Age group
- 16-64 years
- Special properties
- internet users
- Method of interview
- Telephone interviews and online survey
- Supplementary notes
- Original question: How much do you trust each of the following to play an important role in running the Internet? The United Nations
You only have access to basic statistics.
- Instant access to 1m statistics
- Download in XLS, PDF & PNG format
- Detailed references
$49 / Month *
Corporate solution including all features.
Prices do not include sales tax.


I think of Statista as Google for researchers. Statista provides you with the information you search for right away.Dr. Horst Stipp
EVP, Research & Innovation, Advertising Research Foundation
- Online users
- Global digital population as of January 2019 (in millions)Worldwide digital population as of January 2019
- Number of internet users worldwide from 2005 to 2018 (in millions)Global number of internet users 2005-2018
- Number of internet users worldwide from 2009 to 2017, by region (in millions)Number of worldwide internet users 2009-2017, by region
- Number of worldwide internet users as of January 2019, by region (in millions)Number of internet users worldwide 2019, by region
- Global internet penetration rate as of September 2017, by regionInternet penetration rate worldwide 2017, by region
- Countries with the highest number of internet users as of December 2017 (in millions)Countries with the highest number of internet users 2017
- Countries with the highest internet penetration rate as of January 2019Leading online markets based on penetration rate 2019
- Countries with the lowest internet penetration rate as of January 2019Trailing online markets based on penetration rate 2019
- Access and traffic
- Fixed broadband internet subscription rate in 2018, by regionFixed broadband internet subscription rate 2018, by region
- Mobile broadband internet subscription rate in 2018, by regionMobile broadband internet subscription rate 2018, by region
- Countries with the largest rate of high broadband connectivity as of 1st quarter 2017Countries with largest 10 Mbps broadband connectivity 2017
- Countries with the highest average internet connection speed as of 1st quarter 2017 (in Mbps)Countries with the fastest average internet connection speed 2017
- Average global internet connection speed from 1st quarter 2011 to 1st quarter 2017 (in Mbps)Average internet connection speed worldwide 2011-2017
- Number of fixed broadband internet subscriptions worldwide from 2005 to 2018 (in millions)Number of fixed broadband internet subscriptions worldwide 2005-2018
- Leading countries with the most mobile broadband subscriptions per 100 inhabitants in 2017Mobile broadband subscriptions per 100 inhabitants in 2017, by country
- Number of fixed broadband subscriptions in OECD countries as of December 2017 (in millions)OECD: number of fixed broadband subscriptions 2017
- Online usage
- Media usage in an internet minute as of June 2018Media usage in an online minute 2018
- Average number of online activities per device among internet users worldwide as of 2nd quarter 2017Number of distinct online activities worldwide Q2 2017, by device
- Digital device usage for selected online content activities worldwide as of 2nd half 2017, by deviceDigital content access of internet users worldwide 2017, by device
- Distribution of time spent online by internet users worldwide from 1st quarter to 2nd quarter 2017, by region and deviceInternet users time spent online 2017, by region and device
- Daily internet access of users in selected global online markets as of January 2018Global daily internet usage frequency 2018
- Most popular social networks worldwide as of January 2019, ranked by number of active users (in millions)Global social networks ranked by number of users 2019
- Daily time spent on social networking by internet users worldwide from 2012 to 2017 (in minutes)Daily social media usage worldwide 2012-2017
- Share of internet users worldwide who have used a VPN in the past month as of 1st quarter 2018, by regionGlobal VPN usage reach 2018, by region
- Mobile internet
- Mobile internet user penetration rate in selected countries as of 3rd quarter 2017Mobile internet penetration rate worldwide 2017
- Mobile internet traffic as percentage of total web traffic in November 2018, by regionShare of mobile internet traffic in global regions 2018
- Mobile share of total digital minutes in leading online markets as of May 2017Mobile share of digital minutes in selected countries 2017
- App share of total mobile minutes in leading online markets as of May 2017App share of mobile minutes in selected countries 2017
- Number of mobile app downloads worldwide in 2017, 2018 and 2022 (in billions)Annual number of global mobile app downloads 2017-2022
- Worldwide consumer spending on mobile apps in 2017, 2018 and 2022, by region (in billion U.S. dollars)Global gross consumer spend on mobile apps 2017-2022, by region
- Year-on-year growth in time spent per mobile app category in 2017Fastest growing mobile app categories 2017
- Most popular mobile internet activities according to internet users worldwide as of 2nd half 2017, by deviceLeading smartphone and tablet activities 2017, by device
- Digital commerce
- Retail e-commerce sales worldwide from 2014 to 2021 (in billion U.S. dollars)Global retail e-commerce sales 2014-2021
- Annual retail e-commerce sales growth worldwide from 2014 to 2021Retail e-commerce sales growth worldwide 2014-2021
- Retail e-commerce sales CAGR forecast in selected countries from 2018 to 2022Digital Market Outlook: retail e-commerce sales CAGR in selected markets 2018-2022
- Share of population who bought something online via phone in the past month as of 3rd quarter 2017, by countryMobile phone commerce reach in selected countries 2017
- Average value of global online shopping orders as of 3rd quarter 2018, by platform (in U.S. dollars)Global online shopping order value 2018, by platform
- Conversion rate of online shoppers worldwide as of 3rd quarter 2018, by platformGlobal online shopper conversion rate 2018, by platform
- Average e-commerce spending per online shopper worldwide per visit as of 3rd quarter 2018, by vertical (in U.S. dollars)Global online shopper per visit spend 2018, by vertical
- Distribution of retail website visits and orders worldwide as of 3rd quarter 2018, by deviceGlobal online retail website visits and orders 2018, by device
- Digital awareness
- Most commonly encountered cyber threats according to global internet users as of 2nd half 2017Leading cyber threats encountered by internet users worldwide 2017
- Share of internet users who are more concerned about their online privacy compared to a year ago as of March 2018, by regionGlobal opinion on concern about online privacy 2018, by region
- Percentage of internet users in selected countries who have encountered any cyber threat as of 2nd half 2017Cyber crime encounter rate in selected countries 2017
- Most common types of online abuse or harassment experienced by women worldwide as of July 2017Leading types of online abuse or harassment experienced by women 2017
- Share of women in selected countries who have ever personally experienced abuse or harassment online as of July 2017Online abuse and harassment victimization rate of women 2017
- Global number of user data requests issued to Google from federal agencies and governments during 1st half 2018, by country Google: number of data requests from federal agencies and governments H1 2018
- Global number of user data requests issued to Facebook from federal agencies and governments during 1st half 2018, by country Facebook: user data requests from federal agencies and governments H1 2018
- Global number of user data requests issued to Twitter from federal agencies and governments during 1st half 2018, by country Twitter: user data requests from federal agencies and governments H1 2018
- Global opinion on online governance through the UN 2014, by region
- Internet access of companies in China in 2016
- Reasons for giving up fixed internet connection in Finland 2016
- Access locations of internet users in the United Kingdom (UK) 2010-2015
- Locations of internet access used in the United Kingdom (UK) 2012, by frequency
- Accessing the internet at home in the United Kingdom (UK) 2012, by technology
- Technologies used to access the internet at home in the UK 2012, by age
- Reasons for not acquiring an internet connection to the household in Finland 2015
- Technologies used to access the internet at home in the UK 2012, by gender
- Number of internet users per 1,000 people in China 2000-2015
- Households with a internet access in the UK 2017, by household composition
- Important features of access and use of digital tools France 2018
- Professional activities considered eased by digital tools among French people 2018
- Distribution of free and paid Wi-Fi connections in the United States 2010-2013
- Internet penetration rate in India 2007-2017
- Domains whose accessibility has been made easier by digital tools in France 2018
- UK households: ownership of internet connection 1998-2017
- Monthly payments made by UK micro businesses for internet connection in 2014
- Internet usage in Belgium
- Internet usage worldwide
- Internet usage in Japan
- Internet usage in Western Europe
- Internet usage in Eastern Europe
- Internet usage of Millennials in the United States
- Internet usage of Hispanics in the United States
- Internet usage in the Benelux
- Internet usage in the United States
- Mobile internet usage in the United States
- Internet usage of teenagers in the United States
- Internet usage in the United Kingdom (UK)
- Mobile internet usage in the United Kingdom (UK)
- Internet usage in Canada
- Internet usage in the Netherlands
- Global digital population as of January 2019 (in millions)
- Number of internet users worldwide from 2009 to 2017, by region (in millions)
- Number of worldwide internet users as of January 2019, by region (in millions)
- Countries with the highest number of internet users as of December 2017 (in millions)
- Percentage of global population accessing the internet from 2005 to 2018, by market maturity
- Percentage of individuals using the internet worldwide in 2017, by region
- Number of internet users in selected countries in 2018 (in millions)
- Number of internet users in the Asia Pacific region as of January 2018, by country (in millions)
- Number of internet users in selected Latin American countries as of January 2018 (in millions)
- Number of internet users in selected countries in Africa as of December 2017, by country (in millions)
- Internet usage rate worldwide in 2017, by gender and market maturity
- Most common languages used on the internet as of March 2017, by number of speakers (in millions)
- Most common languages used on the internet as of December 2017, by share of internet users
- Market capitalization of the largest internet companies worldwide as of May 2018 (in billion U.S. dollars)
- Fixed broadband internet subscription rate in 2018, by region
- Countries with the largest rate of high broadband connectivity as of 1st quarter 2017
- Countries with the highest average internet connection speed as of 1st quarter 2017 (in Mbps)
- Average global internet connection speed from 1st quarter 2011 to 1st quarter 2017 (in Mbps)
- Leading countries with the most mobile broadband subscriptions per 100 inhabitants in 2017
- Number of fixed broadband subscriptions in OECD countries as of December 2017 (in millions)
- Media usage in an internet minute as of June 2018
- Average number of online activities per device among internet users worldwide as of 2nd quarter 2017
- Digital device usage for selected online content activities worldwide as of 2nd half 2017, by device
- Daily internet access of users in selected global online markets as of January 2018
- Most popular social networks worldwide as of January 2019, ranked by number of active users (in millions)
- Share of internet users worldwide who have used a VPN in the past month as of 1st quarter 2018, by region
- Mobile internet traffic as percentage of total web traffic in November 2018, by region
- Mobile share of total digital minutes in leading online markets as of May 2017
- App share of total mobile minutes in leading online markets as of May 2017
- Number of mobile app downloads worldwide in 2017, 2018 and 2022 (in billions)
- Worldwide consumer spending on mobile apps in 2017, 2018 and 2022, by region (in billion U.S. dollars)
- Year-on-year growth in time spent per mobile app category in 2017
- Most popular mobile internet activities according to internet users worldwide as of 2nd half 2017, by device
- Number of mobile messages sent through WhatsApp as of 4th quarter 2017 (in billions)
- Number of photo messages created by Snapchat users every day from 3rd quarter 2016 to 3rd quarter 2017 (in billions)
- Retail e-commerce sales worldwide from 2014 to 2021 (in billion U.S. dollars)
- Annual retail e-commerce sales growth worldwide from 2014 to 2021
- Retail e-commerce sales CAGR forecast in selected countries from 2018 to 2022
- Share of population who bought something online via phone in the past month as of 3rd quarter 2017, by country
- Average value of global online shopping orders as of 3rd quarter 2018, by platform (in U.S. dollars)
- Most popular payment methods for everyday transactions according to internet users worldwide as of September 2017
- Most commonly encountered cyber threats according to global internet users as of 2nd half 2017
- Share of internet users who are more concerned about their online privacy compared to a year ago as of March 2018, by region
- Most common types of online abuse or harassment experienced by women worldwide as of July 2017
- Share of women in selected countries who have ever personally experienced abuse or harassment online as of July 2017
- Global number of user data requests issued to Google from federal agencies and governments during 1st half 2018, by country
- Global number of user data requests issued to Facebook from federal agencies and governments during 1st half 2018, by country
- Share of global internet users who would trust the United Nations to play an important role in running the internet as of November 2014, by region
- Locations of internet access used in the United Kingdom (UK) in 2012, by frequency
- Accessing the internet at home in the United Kingdom (UK) in 2012, by technology
- Accessing the internet at home in the United Kingdom (UK) in 2012, by age and technology
- Accessing the internet at home in the United Kingdom (UK) in 2012, by gender and technology
- Percentage of households with access to the internet in the United Kingdom (UK) in 2017, by household composition
- Opinion on the most important features of the access and the use of various digital tools and social media in France in 2018
- Percentage of households with internet connection in the United Kingdom (UK) from 1998 to 2017
- Number of internet users worldwide from 2005 to 2018 (in millions)
- Global internet penetration rate as of September 2017, by region
- Countries with the highest internet penetration rate as of January 2019
- Countries with the lowest internet penetration rate as of January 2019
- Internet penetration rate of selected countries in the Middle East in 2016
- Mobile broadband internet subscription rate in 2018, by region
- Number of fixed broadband internet subscriptions worldwide from 2005 to 2018 (in millions)
- Number of fixed broadband subscriptions per 100 inhabitants in OECD countries as of December 2017, by technology
- Distribution of fixed broadband subscriptions in OECD countries as of December 2017, by technology
- Distribution of time spent online by internet users worldwide from 1st quarter to 2nd quarter 2017, by region and device
- Daily time spent on social networking by internet users worldwide from 2012 to 2017 (in minutes)
- Leading motivations for VPN usage worldwide as of 1st quarter 2018, by device
- Mobile internet user penetration rate in selected countries as of 3rd quarter 2017
- Leading mobile-first online activities as of 2nd quarter 2017
- Most popular global mobile messenger apps as of January 2019, based on number of monthly active users (in millions)
- Conversion rate of online shoppers worldwide as of 3rd quarter 2018, by platform
- Average e-commerce spending per online shopper worldwide per visit as of 3rd quarter 2018, by vertical (in U.S. dollars)
- Distribution of retail website visits and orders worldwide as of 3rd quarter 2018, by device
- Distribution of online shopping customers vs. share of retail sales worldwide as of 4th quarter 2017, by platform
- Most important online shopping delivery elements to be actioned by e-retailers according to global online shoppers as of October 2017
- Preferred online shopping device according to global cross-border online shoppers as of October 2017
- Percentage of internet users in selected countries who have encountered any cyber threat as of 2nd half 2017
- Global number of user data requests issued to Twitter from federal agencies and governments during 1st half 2018, by country
- Internet access type of small to medium-sized companies in China in 2016
- For what reasons did you give up your fixed internet connection?
- Internet access locations of web users in the United Kingdom (UK) in 2010 and 2015
- Why haven't you acquired an internet connection in the household?
- Number of internet users per 1,000 people in China from 2000 to 2015
- Opinion of French people on the facilitated handling in certain professional domains thanks to digital tools in 2018, by type of actions
- Distribution of public free and paid Wi-Fi connections in the United States as of 4th quarter 2013
- Internet penetration rate in India from 2007 to 2017
- Opinion of French people on a easier access to certain domains thanks to digital tools in 2018, by area of activities
- How much do you pay for your internet connection?
Statista offers dossiers and reports on over 170 industries. With Statista you are always able to make informed decisions and boost your work efficiency.
Internet & Telecommunications
- Social Media
- E-Commerce
- Online Video & Entertainment
- Advertising & Marketing
Consumer Goods & FMCG
- Alcoholic Beverages
- Cleaning Products
- Cosmetics & Personal Care
- Food & Nutrition
Retail & Trade
- Health & Hygiene
- International Trade
- Shopping Behavior
- Sports & Leisure
Travel, Tourism & Hospitality
- Business Travel
- Leisure Travel
- Accomodation
- Restaurants
Society
- Demographics
- Economy
- Education & Science
- Politics & Government
Transportation & Logistics
- Aviation
- Rail Transport
- Vehicles & Road Traffic
- Water Transport
Register in seconds and access exclusive features.
Basic Account |
Instant Access
Premium Account | ||
---|---|---|---|
Our servicesClick the question mark for further information | Free |
$49 per month* | |
Basic statistics | |||
Premium statistics | |||
Graph download
| |||
Download PDF | |||
Excel download
| |||
Register | Purchase now |
This feature is limited to our corporate solutions.
Please contact us to get started with full access to dossiers, forecasts, studies and international data.

Updates on eCommerce, Digital Media, eTravel, eServices and more
- Market figures for 2018 to 2023
- Company and startup profiles
- User demographics

U.S. coal production has steadily declined in the past decade, but has been in the news in recent years due to President Trump's desire to revitalize the industry. This document provides an overview of the key figures, leading companies, and the employment trends in the U.S. coal mining industry.

This new export feature offers
- Structured graphical representation of the data
- Tailored target group analysis
- Option for further processing

The Polish e-commerce market is one of the fastest developing e-commerce markets in Europe. The latest data for Poland is presented in this dossier.

Plastic waste is an issue of global concern. Since China banned the import of recycled plastic, the U.S. has had to make adjustments to its management of plastic waste. This dossier provides an overview of plastic waste in the U.S.

This dossier provides an overview of hedge funds worldwide. Global hedge fund assets, performance, investors, and other topics are highlighted.

The Outdoor Advertising Association of America covers amongst others
- Number of billboards
- Outdoor advertising revenue
- Number of out-of-home displays

Find data, perceptions & more about
- Economic consequences
- Impact on the labor market
- A second referendum

Understand the recent developments in the Spanish eCommerce market!
- URL-related revenues
- Relevant online store KPIs
- eCommerce-related contacts

- Extended statistical dossier
- Insights, explanations & interpretations
- Challenges of the digital future

eCommerce is rapidly becoming a part of the Latin American shopping culture. The dossier includes data on
- Regional online shopping events
- Events by country

The outline of potential impacts of Brexit on UK industries has been updated in the UK Industry Reports.

Italian enterprises invest significantly in digital marketing. Find out about
- Relevant aspects & KPIs
- New trends
- Different strategies

Statista European Football Benchmark
- The big 5 European leagues
- All about the clubs & fans
- Sponsors & how they fit in

What are online shoppers' payment preferences around the world?
- Data on all payment methods
- Analysis for 50 countries
- Forecasts up to 2023

The kingdom of Saudi Arabia has faced political challenges.
- Perceptions & trade information
- Conflicts with Yemen, Iran, Qatar & Turkey
We use cookies to personalize contents and ads, offer social media features, and analyze access to our website. In your browser settings you can configure or disable this, respectively, and can delete any already placed cookies. For details, please see your browser’s Help section (by pressing F1). Please see our privacy statement for details about how we use data.