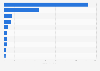
This statistic displays the quantity of pizza, rice, pasta and other cereals consumed per day in the United Kingdom between 2008 and 2012, by age. In this four year period, individuals aged between 19 and 64 years old consumed an average of 85 grams of pasta, rice, pizza and cereal products per day.
Quantity of pizza, rice, pasta and other cereal products consumed per day in the United Kingdom (UK) from 2008 to 2012, by age* (in grams)
Loading statistic...
Basic Account
Get to know the platform
You only have access to basic statistics.
Starter Account
The ideal entry-level account for individual users
- Instant access to 1m statistics
- Download in XLS, PDF & PNG format
- Detailed references
$199 USD / Month *
Professional Account
Full access
Business Solutions including all features.
* Prices do not include sales tax.
Other statistics that may interest you Statistics on
About the industry
7
- Basic Statistic Quantity of ice cream consumed in the United Kingdom (UK) 2008-2012, by age
- Basic Statistic Quantity of soup consumed in the United Kingdom (UK) 2008-2012, by age
- Premium Statistic Latin America: per capita spending on cereal 2016
- Premium Statistic Eating out: weekly consumption of pizza in the UK 2006-2022
- Premium Statistic Average household expenditure on pizza and quiche in Denmark 2010-2022
- Premium Statistic 'Pizzas (Excluding Takeaway)' consumption in FR 2016 - 2022, by type
- Premium Statistic Frequency of consumers of 'Breakfast Cereals (Including Porridge/Oats)' in FR 2022
About the region
10
- Basic Statistic Quantity of biscuit and cake products consumed in the UK 2008-2012, by age
- Basic Statistic Quantity of bread consumed in the United Kingdom 2008-2012, by age
- Basic Statistic Quantity of beer, cider and perry consumed in the United Kingdom 2008-2012, by age
- Basic Statistic Quantity of vegetables consumed in the United Kingdom (UK) 2008-2012, by age
- Basic Statistic Quantity of bacon and ham consumed in the United Kingdom (UK) 2008-2012, by age
- Basic Statistic Quantity of beef and veal consumed in the United Kingdom (UK) 2008-2012, by age
- Basic Statistic Quantity of potato & potato products consumed in the United Kingdom 2008-2012, by age
- Basic Statistic Quantity of sugar confectionery consumed in the United Kingdom (UK) 2008-2012, by age
- Basic Statistic Quantity of breakfast cereal consumed in the United Kingdom (UK) 2008-2012, by age
- Basic Statistic Quantity of chicken and turkey consumed in the United Kingdom (UK) 2008-2012, by age
Other regions
10
- Premium Statistic Rice consumption volume per person in Spain 2011-2021
- Premium Statistic Chile: milled rice consumption volume 2010-2023*
- Premium Statistic Ecuador: milled rice consumption volume 2010-2021
- Basic Statistic European Union-27: rice consumption volume forecast 2016-2030
- Basic Statistic Animal product consumption in French households 2019, by type of product
- Premium Statistic Latin America: per capita consumption of cereal 2016
- Premium Statistic Consumption share of food supplements November in Italy 2016, by region
- Basic Statistic Estimated production volume of food grains India FY 2023, by type
- Premium Statistic Uruguay: milled rice consumption volume 2010-2019
- Premium Statistic Mexico: maize or corn consumption volume 2010-2023*
Related statistics
10
- Basic Statistic Quantity of wine consumed in the United Kingdom (UK) 2008-2012, by age
- Basic Statistic Quantity of nuts and seeds consumed in the United Kingdom (UK) 2008-2012, by age
- Basic Statistic Quantity of savory snacks consumed in the United Kingdom (UK) 2008-2012, by age
- Basic Statistic Opinion: alcohol drinking as a factor for future health problems in the UK 2015
- Basic Statistic Health problems associated with over-consuming alcohol in the UK 2014
- Basic Statistic Reasons why people try to include protein in daily diet 2013
- Basic Statistic Methods most used to consume marijuana and cannabis in Canada 2021 vs 2022
- Basic Statistic Non-medical cannabis use in Canada 2018-2022
- Basic Statistic Alcohol consumption in the past year in England 2021, by gender
- Basic Statistic Maximum alcohol consumption in England 2021, by gender and age
Further related statistics
10
- Total U.S. domestic grain use 2001-2023
- Overweight prevalence in England 2000-2021, by gender
- Number of worldwide users of cocaine by region 2010-2021
- Leading causes of death among the white population in the United States in 2020
- Consumer rating of impact of type of calories on weight gain 2013-2021
- Reasons for consuming low-calorie sweeteners 2019
- Households with internet access in GB from 2014 to 2020, by household composition
- Weight management strategies believed to be most effective 2016
- Information foods/beverages package influence on purchase 2013-2016
- Presence of mental ill health in England 2014, by gender
Further Content: You might find this interesting as well
Statistics
- Total U.S. domestic grain use 2001-2023
- Overweight prevalence in England 2000-2021, by gender
- Number of worldwide users of cocaine by region 2010-2021
- Leading causes of death among the white population in the United States in 2020
- Consumer rating of impact of type of calories on weight gain 2013-2021
- Reasons for consuming low-calorie sweeteners 2019
- Households with internet access in GB from 2014 to 2020, by household composition
- Weight management strategies believed to be most effective 2016
- Information foods/beverages package influence on purchase 2013-2016
- Presence of mental ill health in England 2014, by gender
Public Health England, & Food Standards Agency. (May 14, 2014). Quantity of pizza, rice, pasta and other cereal products consumed per day in the United Kingdom (UK) from 2008 to 2012, by age* (in grams) [Graph]. In Statista. Retrieved April 24, 2024, from https://www.statista.com/statistics/436504/quantity-pizza-and-pasta-consumed-in-the-united-kingdom/
Public Health England, und Food Standards Agency. "Quantity of pizza, rice, pasta and other cereal products consumed per day in the United Kingdom (UK) from 2008 to 2012, by age* (in grams)." Chart. May 14, 2014. Statista. Accessed April 24, 2024. https://www.statista.com/statistics/436504/quantity-pizza-and-pasta-consumed-in-the-united-kingdom/
Public Health England, Food Standards Agency. (2014). Quantity of pizza, rice, pasta and other cereal products consumed per day in the United Kingdom (UK) from 2008 to 2012, by age* (in grams). Statista. Statista Inc.. Accessed: April 24, 2024. https://www.statista.com/statistics/436504/quantity-pizza-and-pasta-consumed-in-the-united-kingdom/
Public Health England, and Food Standards Agency. "Quantity of Pizza, Rice, Pasta and Other Cereal Products Consumed per Day in The United Kingdom (Uk) from 2008 to 2012, by Age* (in Grams)." Statista, Statista Inc., 14 May 2014, https://www.statista.com/statistics/436504/quantity-pizza-and-pasta-consumed-in-the-united-kingdom/
Public Health England & Food Standards Agency, Quantity of pizza, rice, pasta and other cereal products consumed per day in the United Kingdom (UK) from 2008 to 2012, by age* (in grams) Statista, https://www.statista.com/statistics/436504/quantity-pizza-and-pasta-consumed-in-the-united-kingdom/ (last visited April 24, 2024)
Quantity of pizza, rice, pasta and other cereal products consumed per day in the United Kingdom (UK) from 2008 to 2012, by age* (in grams) [Graph], Public Health England, & Food Standards Agency, May 14, 2014. [Online]. Available: https://www.statista.com/statistics/436504/quantity-pizza-and-pasta-consumed-in-the-united-kingdom/