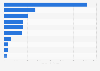
This statistic shows the clothing market demand in Indonesia from 2011 to 2013, including a forecast until 2018. In 2012, market demand of the Indonesian clothing market was approximately 9.1 billion U.S. dollars.
Market demand of clothing in Indonesia from 2011 to 2018 (in billion U.S. dollars)
Basic Account
Get to know the platform
You only have access to basic statistics.
This statistic is not included in your account.
Starter Account
The ideal entry-level account for individual users
- Instant access to 1m statistics
- Download in XLS, PDF & PNG format
- Detailed references
$199 USD / Month *
Professional Account
Full access
Business Solutions including all features.
* Prices do not include sales tax.
Other statistics that may interest you Statistics on
About the industry
10
- Premium Statistic Market demand of clothing in the Philippines 2011-2018
- Premium Statistic Market demand of clothing in Taiwan 2011-2018
- Premium Statistic Market demand of clothing in Vietnam 2011-2018
- Premium Statistic Market demand of clothing in the Asia Pacific region 2011-2018
- Premium Statistic Market demand of clothing in South Korea 2011-2018
- Premium Statistic Market demand of clothing in Hong Kong 2011-2018
- Premium Statistic Market demand of clothing in Japan 2013-2022
- Premium Statistic Market demand of clothing in Thailand 2011-2018
- Premium Statistic Market demand of clothing in India 2011-2018
- Premium Statistic Market demand of clothing in Malaysia 2011-2018
About the region
8
- Premium Statistic Indonesia: revenue in the apparel market 2020-2028, by segment
- Premium Statistic Indonesia: revenue in the e-commerce fashion industry 2023, by segment
- Premium Statistic Indonesia: apparel market sales channel share 2021-2029
- Premium Statistic Monthly retail sales index of apparel Indonesia 2022
- Premium Statistic YOY growth of monthly retail sales index of apparel Indonesia 2022
- Premium Statistic Per capita availability of palm oil Indonesia 2016-2020
- Premium Statistic Domestic utilization of palm oil Indonesia 2014-2018
- Premium Statistic Domestic utilization of palm oil for cooking purposes Indonesia 2014-2018
Selected statistics
4
Other regions
6
- Premium Statistic Market demand of clothing in Singapore 2011-2018
- Premium Statistic Number of employees of Missguided Limited worldwide 2013-2020
- Basic Statistic Polo Ralph Lauren's revenue share as of 2023, by region
- Premium Statistic Forecasted apparel market value Philippines 2018-2022
- Premium Statistic Forecasted apparel market value in Japan 2018-2022
- Premium Statistic Changes in popularity trends of jewelry, watches and perfumes in Poland 2019-2020
Related statistics
6
- Premium Statistic Employment in the footwear, luggage and handbags industry in Indonesia 2016 by gender
- Premium Statistic GTF industry share of manufacturing employment in Indonesia 2016 by gender
- Premium Statistic Packaged food and drink sales value in Indonesia 2010-2020
- Premium Statistic Demand growth in the soap and cleaning agent market Indonesia 2011-2018
- Premium Statistic Forecast for Indonesia's retail sales 2008-2016
- Premium Statistic Indonesia: percentage of global B2C e-commerce sales 2010-2016
Further related statistics
10
- Under Armour's operating income worldwide 2008-2023
- Victoria's Secret's net sales worldwide from 2010 to 2022
- Net earnings of the Puma Group worldwide from 1993 to 2023
- Revenues of VF Corporation's active segment worldwide 2016 to 2023
- John Lewis Partnership: number of employees in the United Kingdom (UK) 2009-2023
- John Lewis sales revenue in the United Kingdom (UK) 2009-2023
- John Lewis: number of stores in the United Kingdom (UK) 2009-2023
- The adidas Group's global net sales from 2002 to 2023, by product category
- Puma Group's market capitalization worldwide 1993-2023
- John Lewis online sales growth in the United Kingdom (UK) 2011-2018
Further Content: You might find this interesting as well
Statistics
- Under Armour's operating income worldwide 2008-2023
- Victoria's Secret's net sales worldwide from 2010 to 2022
- Net earnings of the Puma Group worldwide from 1993 to 2023
- Revenues of VF Corporation's active segment worldwide 2016 to 2023
- John Lewis Partnership: number of employees in the United Kingdom (UK) 2009-2023
- John Lewis sales revenue in the United Kingdom (UK) 2009-2023
- John Lewis: number of stores in the United Kingdom (UK) 2009-2023
- The adidas Group's global net sales from 2002 to 2023, by product category
- Puma Group's market capitalization worldwide 1993-2023
- John Lewis online sales growth in the United Kingdom (UK) 2011-2018
PwC. (February 12, 2015). Market demand of clothing in Indonesia from 2011 to 2018 (in billion U.S. dollars) [Graph]. In Statista. Retrieved April 23, 2024, from https://www.statista.com/statistics/616399/indonesia-clothing-market-demand/
PwC. "Market demand of clothing in Indonesia from 2011 to 2018 (in billion U.S. dollars)." Chart. February 12, 2015. Statista. Accessed April 23, 2024. https://www.statista.com/statistics/616399/indonesia-clothing-market-demand/
PwC. (2015). Market demand of clothing in Indonesia from 2011 to 2018 (in billion U.S. dollars). Statista. Statista Inc.. Accessed: April 23, 2024. https://www.statista.com/statistics/616399/indonesia-clothing-market-demand/
PwC. "Market Demand of Clothing in Indonesia from 2011 to 2018 (in Billion U.S. Dollars)." Statista, Statista Inc., 12 Feb 2015, https://www.statista.com/statistics/616399/indonesia-clothing-market-demand/
PwC, Market demand of clothing in Indonesia from 2011 to 2018 (in billion U.S. dollars) Statista, https://www.statista.com/statistics/616399/indonesia-clothing-market-demand/ (last visited April 23, 2024)
Market demand of clothing in Indonesia from 2011 to 2018 (in billion U.S. dollars) [Graph], PwC, February 12, 2015. [Online]. Available: https://www.statista.com/statistics/616399/indonesia-clothing-market-demand/