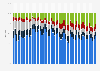
In 2010, there were two reported smelters or refiners in Apple's supply chain (out of a total of 109 smelters or refiners) that were either participating in or verified through a third-party audit to guarantee that they were not using tantalum, tin, tungsten, or gold (also know as 3TG) from regions where these materials are produced in conditions of armed conflict or human rights abuses. By 2015, all of the smelters and refiners in Apple's supply chain were verified to not be using conflict minerals.
Number of conflict mineral-free verified smelters and refiners in Apple's supply chain from 2009 to 2015*
Characteristic
Reported smelters or refiners participating in or verified through a third party audit
Total reported smelters or refiners
-
-
-
-
-
-
-
-
-
-
-
-
-
-
-
-
-
-
-
-
-
Exclusive Premium Statistic
To access all Premium Statistics, you need a paid Statista Account
* Number of smelters and refiners in Apple's supply chain that are either participating in or are verified through a third party audit that verifies that their supplies of tantalum, tin, tungsten, and gold (also known as 3TG) are not originating in the Democratic Republic of the Congo (DRC) or the adjacent countries.
** Zero smelters identified.
Profit from the additional features of your individual account
Currently, you are using a shared account. To use individual functions (e.g., mark statistics as favourites, set
statistic alerts) please log in with your personal account.
If you are an admin, please authenticate by logging in again.
Learn more about how Statista can support your business.
gamesindustry.biz. (June 9, 2016). Number of conflict mineral-free verified smelters and refiners in Apple's supply chain from 2009 to 2015* [Graph]. In Statista. Retrieved July 27, 2024, from https://www.statista.com/statistics/662349/conflict-mineral-free-verified-smelters-and-refiners-in-apples-supply-chain/
gamesindustry.biz. "Number of conflict mineral-free verified smelters and refiners in Apple's supply chain from 2009 to 2015*." Chart. June 9, 2016. Statista. Accessed July 27, 2024. https://www.statista.com/statistics/662349/conflict-mineral-free-verified-smelters-and-refiners-in-apples-supply-chain/
gamesindustry.biz. (2016). Number of conflict mineral-free verified smelters and refiners in Apple's supply chain from 2009 to 2015*. Statista. Statista Inc.. Accessed: July 27, 2024. https://www.statista.com/statistics/662349/conflict-mineral-free-verified-smelters-and-refiners-in-apples-supply-chain/
gamesindustry.biz. "Number of Conflict Mineral-free Verified Smelters and Refiners in Apple's Supply Chain from 2009 to 2015*." Statista, Statista Inc., 9 Jun 2016, https://www.statista.com/statistics/662349/conflict-mineral-free-verified-smelters-and-refiners-in-apples-supply-chain/
gamesindustry.biz, Number of conflict mineral-free verified smelters and refiners in Apple's supply chain from 2009 to 2015* Statista, https://www.statista.com/statistics/662349/conflict-mineral-free-verified-smelters-and-refiners-in-apples-supply-chain/ (last visited July 27, 2024)
Number of conflict mineral-free verified smelters and refiners in Apple's supply chain from 2009 to 2015* [Graph], gamesindustry.biz, June 9, 2016. [Online]. Available: https://www.statista.com/statistics/662349/conflict-mineral-free-verified-smelters-and-refiners-in-apples-supply-chain/