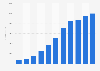
The statistic shows the advertising and promotional expenses of the Alibaba Group from fiscal year 2014 to 2024. In the fiscal year ending March 31, 2024, Chinese e-commerce corporation Alibaba invested approximately 88.22 billion yuan in advertising and promotional activities.
Advertising and promotional expenses of Alibaba Group from FY 2014 to 2024
(in billion yuan)
Profit from the additional features of your individual account
Currently, you are using a shared account. To use individual functions (e.g., mark statistics as favourites, set
statistic alerts) please log in with your personal account.
If you are an admin, please authenticate by logging in again.
Learn more about how Statista can support your business.
Alibaba. (May 23, 2024). Advertising and promotional expenses of Alibaba Group from FY 2014 to 2024 (in billion yuan) [Graph]. In Statista. Retrieved September 19, 2024, from https://www.statista.com/statistics/685796/alibaba-ad-spend/
Alibaba. "Advertising and promotional expenses of Alibaba Group from FY 2014 to 2024 (in billion yuan)." Chart. May 23, 2024. Statista. Accessed September 19, 2024. https://www.statista.com/statistics/685796/alibaba-ad-spend/
Alibaba. (2024). Advertising and promotional expenses of Alibaba Group from FY 2014 to 2024 (in billion yuan). Statista. Statista Inc.. Accessed: September 19, 2024. https://www.statista.com/statistics/685796/alibaba-ad-spend/
Alibaba. "Advertising and Promotional Expenses of Alibaba Group from Fy 2014 to 2024 (in Billion Yuan)." Statista, Statista Inc., 23 May 2024, https://www.statista.com/statistics/685796/alibaba-ad-spend/
Alibaba, Advertising and promotional expenses of Alibaba Group from FY 2014 to 2024 (in billion yuan) Statista, https://www.statista.com/statistics/685796/alibaba-ad-spend/ (last visited September 19, 2024)
Advertising and promotional expenses of Alibaba Group from FY 2014 to 2024 (in billion yuan) [Graph], Alibaba, May 23, 2024. [Online]. Available: https://www.statista.com/statistics/685796/alibaba-ad-spend/