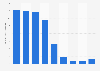
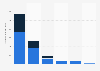
In 2018, the company's net turnover was by far highest in the e-commerce segment and reached approximately three billion Swedish kronor. With financial service, the company generated a net turnover of roughly 281 million Swedish kronor. The eliminations made up a loss of 6.7 million Swedish kronor.
Net turnover of the Qliro Group in 2018, by segment (in million SEK)
Basic Account
Get to know the platform
You only have access to basic statistics.
This statistic is not included in your account.
Starter Account
The ideal entry-level account for individual users
- Instant access to 1m statistics
- Download in XLS, PDF & PNG format
- Detailed references
$199 USD / Month *
Professional Account
Full access
Business Solutions including all features.
* Prices do not include sales tax.
Other statistics that may interest you Statistics on
About the industry
10
- Premium Statistic Net turnover of the Qliro Group 2019, by country
- Premium Statistic Number of employees of the Qliro Group 2018, by business segment
- Premium Statistic Grocery stores: quarterly online transactions in Spain 2014-2023
- Premium Statistic External and internal net turnover of the Qliro Group's online stores 2019, by store
- Premium Statistic Most preferred payment method among U.S. online shoppers 2017
- Basic Statistic Cart abandonment rate of e-commerce websites in France 2023, by device
- Premium Statistic Blue Apron's order share 2019-2022, by meal type
- Premium Statistic Blue Apron's revenue 2014-2022
- Premium Statistic Blue Apron's quarterly customer base 2015-2022
- Premium Statistic Blue Apron's quarterly order volume 2015-2022
About the region
10
- Premium Statistic Net turnover of CDON Marketplace 2013-2018
- Premium Statistic Concerns about using the internet for banking and ecommerce in Sweden 2019
- Premium Statistic Payment preferences among online shoppers in Sweden 2019, by payment type
- Premium Statistic Number of orders at CDON Marketplace 2013-2018
- Premium Statistic Average shopping basket size of customers of CDON Marketplace 2013-2018
- Premium Statistic Net turnover of Nelly 2013-2018
- Premium Statistic Number of active customers of CDON Marketplace 2013-2018
- Premium Statistic Net turnover of Gymgrossisten 2013-2016
- Premium Statistic Digital marketing use in the Sweden 2020, by channel
- Premium Statistic Share of major companies having mobile presence in Sweden 2020
Selected statistics
1
Other regions
10
- Basic Statistic Payments made during COVID-19 epidemic in Romania 2020, by type
- Premium Statistic Online purchases of new products and services due to COVID-19 in Finland 2020
- Premium Statistic Brazil: net sales of PagSeguro 2015-2019, by sector
- Premium Statistic Online payment methods used in Denmark 2013-2019
- Premium Statistic Concerns about using the internet for banking and ecommerce in the UK 2019
- Premium Statistic Concerns about using the internet for banking and ecommerce in the EU 2019
- Premium Statistic Leading mobile payment providers in South Korea 2021
- Premium Statistic Main categories bought online in Ecuador 2021
- Premium Statistic Alternative finance transaction volume per capita in Europe 2020, by country
- Premium Statistic Leading payment methods for online shopping in Belgium 2016-2020
Related statistics
10
- Premium Statistic Number of orders of customers of the Qliro Group's online stores 2012-2019
- Premium Statistic Number of active customers of Nelly 2013-2018
- Premium Statistic Number of orders at Nelly 2013-2018
- Premium Statistic Average shopping basket size of customers of Nelly 2013-2018
- Premium Statistic Share of private labels of the total sales of Nelly 2013-2018
- Premium Statistic Average shopping basket size Gymgrossisten customers 2013-2016
- Premium Statistic Revenue of Salling Group 2012-2022
- Premium Statistic Net revenue of Norrmejerier in Sweden 2012-2020
- Premium Statistic Average shopping basket size of the Qliro Group's online stores 2012-2019
- Premium Statistic Number of visitors of the Qliro Group's online stores 2012-2019
Further related statistics
10
- Senior chief financial officer salary per annum in Switzerland 2023
- Global net sales of Monster Beverage 2008-2022
- Mondelez International's net revenue distribution worldwide by sector 2022
- BlackBerry net income/loss 2009-2023
- Total revenue of Prudential Financial 2006-2022
- Net revenue from investment banking at Goldman Sachs 2009-2023
- Revenue of Salesforce.com broken down 2009-2023, by segment
- Revenue and financial key figures of Coca-Cola 2010-2023
- International Paper's revenue 2010-2023
- Sales of Johnson & Johnson worldwide 2011-2023, by segment
Further Content: You might find this interesting as well
Statistics
- Senior chief financial officer salary per annum in Switzerland 2023
- Global net sales of Monster Beverage 2008-2022
- Mondelez International's net revenue distribution worldwide by sector 2022
- BlackBerry net income/loss 2009-2023
- Total revenue of Prudential Financial 2006-2022
- Net revenue from investment banking at Goldman Sachs 2009-2023
- Revenue of Salesforce.com broken down 2009-2023, by segment
- Revenue and financial key figures of Coca-Cola 2010-2023
- International Paper's revenue 2010-2023
- Sales of Johnson & Johnson worldwide 2011-2023, by segment
Qliro Group. (April 3, 2019). Net turnover of the Qliro Group in 2018, by segment (in million SEK) [Graph]. In Statista. Retrieved April 26, 2024, from https://www.statista.com/statistics/780305/net-turnover-of-the-qliro-group-by-segment/
Qliro Group. "Net turnover of the Qliro Group in 2018, by segment (in million SEK)." Chart. April 3, 2019. Statista. Accessed April 26, 2024. https://www.statista.com/statistics/780305/net-turnover-of-the-qliro-group-by-segment/
Qliro Group. (2019). Net turnover of the Qliro Group in 2018, by segment (in million SEK). Statista. Statista Inc.. Accessed: April 26, 2024. https://www.statista.com/statistics/780305/net-turnover-of-the-qliro-group-by-segment/
Qliro Group. "Net Turnover of The Qliro Group in 2018, by Segment (in Million Sek)." Statista, Statista Inc., 3 Apr 2019, https://www.statista.com/statistics/780305/net-turnover-of-the-qliro-group-by-segment/
Qliro Group, Net turnover of the Qliro Group in 2018, by segment (in million SEK) Statista, https://www.statista.com/statistics/780305/net-turnover-of-the-qliro-group-by-segment/ (last visited April 26, 2024)
Net turnover of the Qliro Group in 2018, by segment (in million SEK) [Graph], Qliro Group, April 3, 2019. [Online]. Available: https://www.statista.com/statistics/780305/net-turnover-of-the-qliro-group-by-segment/