Skip to main content
Consumer Goods & FMCG
E-Commerce
Economy & Politics
Energy & Environment
Health, Pharma & Medtech
Internet
Media
Technology & Telecommunications
Transportation & Logistics
Travel, Tourism & Hospitality
View all industries
Global data volume growth
Global AI market size
Number of generative AI users worldwide
Global inflation rate
Retail e-commerce sales worldwide
Largest economies worldwide
Biggest social media platforms by users
Global EV market share by manufacturer
International tourist arrivals by world region
Global annual CO₂ emissions
Browse recent statistics
Artificial intelligence (AI) worldwide
TikTok
Nvidia
E-commerce worldwide
Global GDP
Instagram
Apparel market worldwide
Video gaming worldwide
Global renewable energy industry
Influencer marketing worldwide
Browse recent topics
Consumer Trends 2026
Artificial Intelligence: in-depth market analysis
E-commerce challenges
Global economy
TikTok
Luxury goods: in-depth market analysis
Electric vehicles: A global overview
Video gaming worldwide
Travel and tourism trends 2026
Battery recycling worldwide
Browse recent reports
Explore the tool
Explore Classic mode
Advertising & Media
eCommerce
Consumer
Finance
Global Indicators
Health
Industrial
Mobility
Technology
Explore Market Insights
eCommerce Insights
Research AI
Book a demo
All integrations
Developer docs
Explore Statista Connect
Research
Strategy & Consulting
Marketing
Media & PR
Explore AI assistants
Marketing
Research & Development
Strategy
Sales
Find the fact
Tell the story
Win the pitch
Understand the market
Develop your strategy
Academia
Agencies
Consultancies
Consumer goods
Finance
Tech
Research solutions
Strategy consulting
Communication services
Explore Statista+
Statista R
Statista Healthcare
About Statista
First steps & help center
Webinar & training hub
Success stories
Individuals & Small Teams
Businesses & Enterprises
Academia & Government
English
Deutsch
Daily Data
Infographics on the topic "+"
Digital Privacy
Jul 26, 2017
This chart shows the share of Americans who check their partner's text messages at least once a week without permission, by age group.
More Information
Fatal police shootings
Jul 25, 2017
This graphic shows the number of fatalities during police contact in England and Wales by financial year.
More Information
Digital Advertising
Jul 25, 2017
This chart shows the percentage change in number of advertisers year-over-year Q1 2016 to 2017, by ad format
More Information
Job Qualifications
Jul 25, 2017
This chart shows the median annual wage in jobs typically not requiring a 4-year bachelor degree (2016).
More Information
Migration
Jul 25, 2017
This chart shows the number of refugee arrivals by region in Italy in H1 2017
More Information
U.S. Politics
Jul 25, 2017
This chart shows the average job approval of President Trump from January to June 2017, by state.
More Information
Web Browsers
Jul 24, 2017
This chart shows worldwide browser market share by platform.
More Information
UK
Jul 24, 2017
This chart shows the number of products on sale in the UK that have changed in size from January 2012 to June 2017, by type.
More Information
Foreign Trade
Jul 24, 2017
This chart shows U.S. merchandise trade with Russia (in billion U.S. dollars)
More Information
Q2 Sales
Jul 24, 2017
This chart shows smartphone units sold in Q2 2017 compared to Q2 2016, by region.
More Information
Smart Toys
Jul 24, 2017
This graphic shows the potenial market volume until 2020 in billion euros.
More Information
Latest Projections
Jul 24, 2017
This chart shows the year-on-year output growth estimates and projections of the U.S., U.K. and world as of July 2017.
More Information
Ireland
Jul 21, 2017
This chart shows total mortgage to rent applications and number complete in Ireland from Q4 2015 to Q2 2017.
More Information
North Korea
Jul 21, 2017
This graphic shows the estimated GDP growth rate of North Korea in the past ten years.
More Information
Q4 Results
Jul 21, 2017
This chart shows Microsoft's annualized commercial cloud revenue run rate.
More Information
Brexit
Jul 21, 2017
This chart shows the number of UK-born people now living in other EU countries.
More Information
Europe
Jul 21, 2017
This chart shows the share of Irish adults that think Ireland should remain a part of the EU as of 2017.
More Information
World Population
Jul 21, 2017
This chart shows the age structure of the world's population in 1950, 2015 and 2100
More Information
Tobacco
Jul 20, 2017
This chart shows the number of countries in which tobacco packaging must carry a large graphic warning.
More Information
Harley Davidson
Jul 20, 2017
This graphic shows Harley Davidson's worldwide Q2 revenue by category from 2011 to 2017.
More Information
Tech
Jul 20, 2017
This chart shows the S&P 500 Information Technology sector from July 19, 2007 to July 19, 2017.
More Information
U.S. Politics
Jul 20, 2017
This chart shows the states visited in the first six months of presidency by Trump, Obama and Bush.
More Information
Most And Least Active Countries
Jul 20, 2017
This chart shows the average amount of steps taken each day in selected countries.
More Information
Germany
Jul 20, 2017
This chart shows venture capital invested in German startups.
More Information
Public Sector Employment
Jul 20, 2017
This chart shows employment in general government as a percentage of total employment (2015).
More Information
Drug Seizures
Jul 20, 2017
This chart shows Amount of cocaine seized by Customs and Border Patrol (CBP) officers in the U.S. (in pounds)
More Information
Drugs Production
Jul 20, 2017
This chart shows the cultivation area for coca and the production potential for cocaine in Colombia
More Information
Global Emotions
Jul 19, 2017
This graphic shows the top ten countries with the lowest negative experiences according to the Gallup index score 2017.
More Information
HNWI
Jul 19, 2017
This chart shows the most popular emigration destination for Chinese HNWI in 2017.
More Information
Russia Meeting
Jul 19, 2017
This chart shows the public view on Trump's son & advisors meeting with a Russian lawyer during the 2016 campaign.
More Information
IBM
Jul 19, 2017
This chart shows IBM's revenue growth since 2011.
More Information
Migration
Jul 19, 2017
This chart shows migrant sea arrivals in Europe by selected countries of arrival since January 2015
More Information
Auto Industry
Jul 18, 2017
This chart shows the number of newly registered electric vehicles in China and the U.S. from 2010 to 2016.
More Information
Nigeria
Jul 18, 2017
This chart shows the number of deaths caused by Boko Haram in Nigeria in 2017.
More Information
The Royal Family
Jul 18, 2017
This chart shows the net revenue profit of the Crown Estate from 2012 to 2017.
More Information
GOP Health Care Bill
Jul 18, 2017
This chart shows Senator's positions on the revised health care bill.
More Information
Tourism
Jul 18, 2017
This graphic shows the number of tourist arrivals in Dubrovnik by year (in million).
More Information
Donald Trump
Jul 18, 2017
This chart shows responses to: "Why do you disapprove/approve of the way Trump is handling his job as president?" (%)
More Information
Digital Retail vs High Street
Jul 18, 2017
This chart shows the share of consumers in selected countries who shop less often at retail stores because of Amazon
More Information
China
Jul 17, 2017
This chart shows passenger car sales in China in 2016, by manufacturer.
More Information
Ride-Hailing
Jul 17, 2017
This chart compares key figures for Uber and its Chinese counterpart DiDi.
More Information
Health Care
Jul 17, 2017
This chart shows number of U.S. adults without health insurance under current law and the proposed Better Care Reconciliation Act (BCRA)
More Information
Donald Trump
Jul 17, 2017
This chart shows responses to "why do you disapprove of the way Trump is handling his job as president?"
More Information
Amazon
Jul 17, 2017
This infographic shows the influence Amazon has had on global shopping behavior in 2017.
More Information
Online vs in-store shopping
Jul 17, 2017
This graphic shows the percentage share of online and in-store purchases by category.
More Information
Crime in the UK
Jul 17, 2017
This chart shows noxious/corrosive liquids offences in London (2015 to 2017)
More Information
Women
Jul 14, 2017
This graphic shows the likeliness of hiring a woman for a public-facing job who has hair on her face.
More Information
Soccer/Football
Jul 14, 2017
This chart shows the revenue of the "Big Five" European football leagues (in billion euros) since 1996/1997
More Information
Crime in America
Jul 14, 2017
This chart shows trends in violent and property crime in the United States (1993 vs. 2015)
More Information
Tourism in Turkey
Jul 13, 2017
This graphic illustrates the number of foreign visitors arriving in Turkey per year and quarter in thousands.
More Information
PC Market
Jul 13, 2017
This chart shows the top 6 PC vendors worldwide based on unit shipments in Q2 2017.
More Information
Air Safety
Jul 13, 2017
This chart shows the number of airplanes that crashed per five million flights in 1970 and 2015
More Information
Cat Owners
Jul 13, 2017
This chaert shows the share of people who own a cat in selected countries in 2017.
More Information
News Media
Jul 13, 2017
This chart shows the share of consumers who prefer selected gateways to digital news content
More Information
Steel Industry
Jul 13, 2017
This graphic shows the quantity of crude steel for selected categories in millions of metric tons as well as steel imports by top source...
More Information
Employment in the UK
Jul 12, 2017
This graphic illustrates the share of full-time employees in the UK work force.
More Information
iPhone
Jul 12, 2017
This chart shows the worldwide installed base of iPhones as of April 2017.
More Information
Natural Hazards
Jul 12, 2017
This chart shows the number of wildfires and acres burnt in the Unites States (1st half of year)
More Information
YouTube Hits
Jul 12, 2017
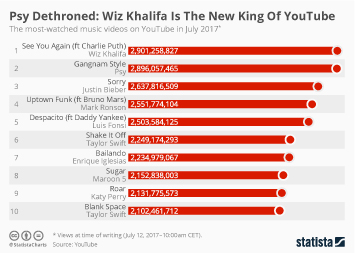
This chart shows the most-watched music videos on YouTube in July 2017.
More Information
U.S. Car Imports
Jul 12, 2017
This graphic illustrates the monthly number of cars imported by the U.S. from Mexico in the first half of 2016 and 2017 respectively....
More Information
Russian Military Activity In UK Airspace
Jul 12, 2017
This chart shows the number of days the Royal Air Force's Quick Reaction Alert launched (2005-2016).
More Information
U.S. Higher Education
Jul 12, 2017
This chart shows the percentage saying each of the following has a positive/negative effect on the way things are going in the country....
More Information
Summer
Jul 12, 2017
This chart shows the theme parks in Europe that had the most visitors in 2016.
More Information
Self-Driving Trucks
Jul 11, 2017
This graphic illustrates the average annual operating costs by category for an average long-haul truck in thousand euros.
More Information
Cars
Jul 11, 2017
This chart shows consumer automotive loyalty rates in the United States, by body style.
More Information
Germany
Jul 11, 2017
This chart shows the level of child benefit in Germany (euro per month).
More Information
Prime Day
Jul 11, 2017
This chart shows how many unique visitors Amazon had on Prime Day and Cyber Monday in the past two years.
More Information
Public Transport
Jul 11, 2017
This graphic shows the ten cities worldwide where commuting via public transport costs the most.
More Information
Drug-Induced Deaths
Jul 11, 2017
This chart shows drug-induced deaths per million of the population.
More Information
Brexit
Jul 11, 2017
This chart shows the percentage increase in cost of English breakfast products with WTO tariffs.
More Information
Politics
Jul 10, 2017
This chart shows the countries with the most diplomatic posts abroad as of 2016.
More Information
Automotive Industry
Jul 10, 2017
This chart shows employment in manufacturing in the motor vehicle sector and sales in the United States.
More Information
Tea and Coffee
Jul 10, 2017
This graphic illustrates the amount of coffee and tea purchased in grams per person per week in the UK.
More Information
UK-Saudi Arms Trade
Jul 10, 2017
This chart shows the value of UK arms exports to Saudi Arabia from 2008 to 2016.
More Information
G20
Jul 10, 2017
This chart brings together key figures for the police operation related to the G20 summit in Hamburg.
More Information
Alcohol Consumption
Jul 6, 2017
This graphic shows the top 10 countries by average number of alcoholic drinks consumed per capita and day.
More Information
G20 & the World Economy
Jul 6, 2017
This chart shows the share of the world economic output by groups of states and the U.S. based on GDP.
More Information
G20
Jul 6, 2017
This chart shows the percentage confident in Merkel/Trump to do the right thing regarding world affairs.
More Information
Travel Times
Jul 6, 2017
This chart shows how the time to get from Portugal to India has evolved since 1498.
More Information
Travel Ban 2.0
Jul 6, 2017
This chart shows the share of Americans supporting the new State Department travel guidelines.
More Information
Shopping Behavior
Jul 5, 2017
This chart shows where U.S. online shoppers begin searching for products.
More Information
Soccer
Jul 5, 2017
This chart shows the share of Premier League fans that stream matches illegally in 2017.
More Information
Tesla
Jul 5, 2017
This chart compares Tesla's vehicle deliveries in the first half of 2017 to those of GM, Ford and Fiat Chrysler.
More Information
Fireworks Injuries
Jul 5, 2017
This chart shows the number of fireworks-related hospital visits in the U.S. from 2006 to 2010.
More Information
Global Influencers
Jul 5, 2017
This chart shows the share saying the following have a strongly/somewhat positive influence on world affairs.
More Information
Budgets
Jul 5, 2017
Budget balance of G20 members as share of GDP 2016 (in percent)
More Information
Brands
Jul 5, 2017
This chart shows the share of British consumers over the age of 16 years who distrust brands (in percent)
More Information
Craft Beer
Jul 4, 2017
This chart shows how familiar U.S. consumers are with craft beer terminology.
More Information
G20
Jul 4, 2017
This chart shows the number of extremists residing in G20 host city Hamburg, by type.
More Information
Smart assistants
Jul 4, 2017
This chart shows how many third-party skills are available for Amazon's smart assistant Alexa.
More Information
125
/
161
Contact
Get in touch with us. We are happy to help.
Do you still have questions?
Feel free to contact us anytime using our
contact form
or visit our
FAQ page
.
Your contact to the Infographics Newsroom
Felix Richter
Data Journalist
felix.richter@statista.com
+49 (40) 284 841 557