Skip to main content
Consumer Goods & FMCG
E-Commerce
Economy & Politics
Energy & Environment
Health, Pharma & Medtech
Internet
Media
Technology & Telecommunications
Transportation & Logistics
Travel, Tourism & Hospitality
View all industries
Global data volume growth
Global AI market size
Number of generative AI users worldwide
Global inflation rate
Retail e-commerce sales worldwide
Largest economies worldwide
Biggest social media platforms by users
Global EV market share by manufacturer
International tourist arrivals by world region
Global annual CO₂ emissions
Browse recent statistics
Artificial intelligence (AI) worldwide
TikTok
Nvidia
E-commerce worldwide
Global GDP
Instagram
Apparel market worldwide
Video gaming worldwide
Global renewable energy industry
Influencer marketing worldwide
Browse recent topics
Consumer Trends 2026
Artificial Intelligence: in-depth market analysis
E-commerce challenges
Global economy
TikTok
Luxury goods: in-depth market analysis
Electric vehicles: A global overview
Video gaming worldwide
Travel and tourism trends 2026
Battery recycling worldwide
Browse recent reports
Explore the tool
Explore Classic mode
Advertising & Media
eCommerce
Consumer
Finance
Global Indicators
Health
Industrial
Mobility
Technology
Explore Market Insights
eCommerce Insights
Research AI
Book a demo
All integrations
Developer docs
Explore Statista Connect
Research
Strategy & Consulting
Marketing
Media & PR
Explore AI assistants
Marketing
Research & Development
Strategy
Sales
Find the fact
Tell the story
Win the pitch
Understand the market
Develop your strategy
Academia
Agencies
Consultancies
Consumer goods
Finance
Tech
Research solutions
Strategy consulting
Communication services
Explore Statista+
Statista R
Statista Healthcare
About Statista
First steps & help center
Webinar & training hub
Success stories
Individuals & Small Teams
Businesses & Enterprises
Academia & Government
English
Deutsch
Daily Data
Infographics on the topic "+"
Halloween
Oct 28, 2026
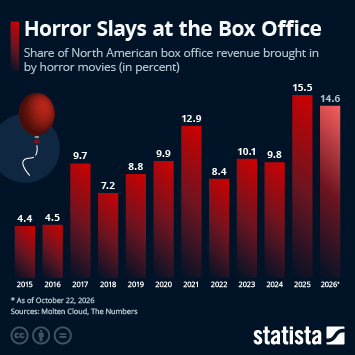
This chart shows the share of North American box office revenue brought in by horror movies.
More Information
Transportation & Logistics
Oct 27, 2026
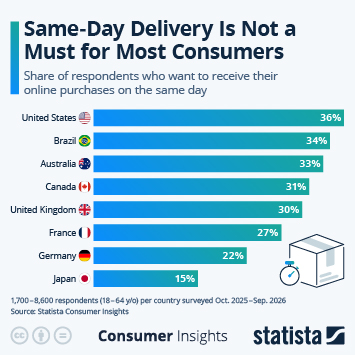
This chart shows the share of consumers in selected countries who want to receive their online orders on the same day.
More Information
Transportation & Logistics
Oct 27, 2026
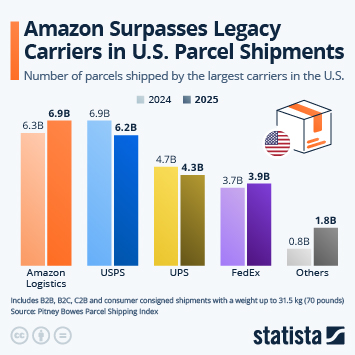
This chart shows how many parcels the largest carriers in the U.S. delivered in 2024 and 2025.
More Information
Transportation & Logistics
Oct 27, 2026
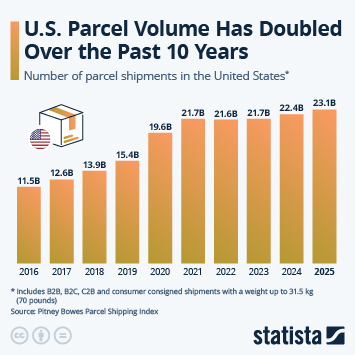
This chart shows how many parcels are shipped in the United States each year.
More Information
Midterms
Oct 26, 2026
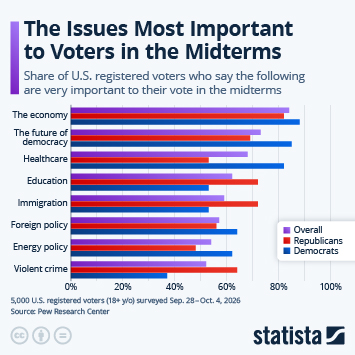
This chart shows the share of U.S. registered voters who say the following are very important to their vote in the midterms.
More Information
Politics
Oct 26, 2026
This chart shows the share of respondents who have expressed their opinion about politics online in the past month, by country.
More Information
Sponsored post by Booking.com
Oct 23, 2026
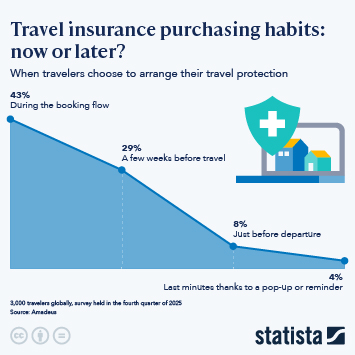
This infographic shows at what time in the booking flow travelers obtain their travel insurance.
More Information
Netflix
Oct 23, 2026
This chart shows Netflix's operating margin and revenue growth since 2016.
More Information
Netflix
Oct 23, 2026
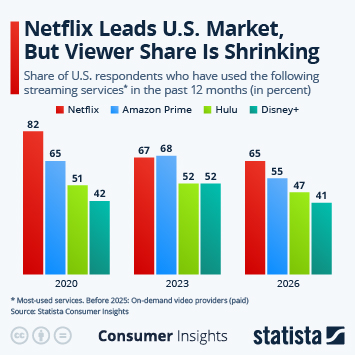
This chart shows the share of U.S. respondents who have used the following streaming services in the past 12 months.
More Information
Video Streaming
Oct 23, 2026
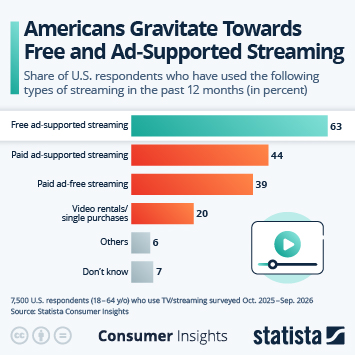
This chart shows the share of respondents who have used the following types of streaming in the past 12 months.
More Information
Foldables
Oct 22, 2026
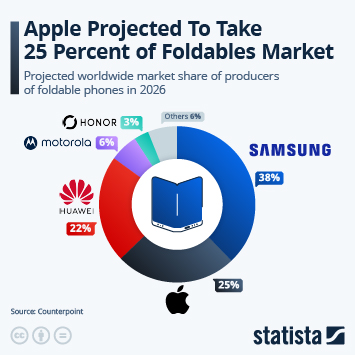
This chart shows the projected worldwide market share of producers of foldable phones in 2026.
More Information
Tesla
Oct 22, 2026
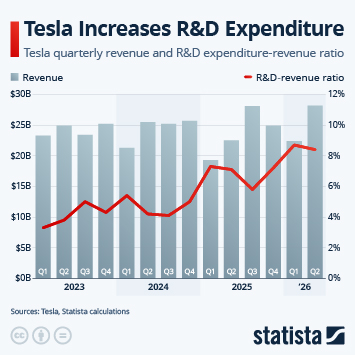
This chart shows Tesla's quarterly revenue and R&D expenditure-revenue ratio.
More Information
Electronic Stores
Oct 22, 2026
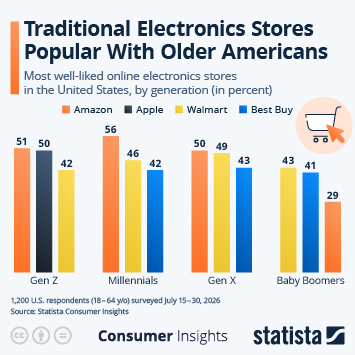
This chart shows the most well-liked online electronics stores in the U.S. by generation.
More Information
U.S. Refugee Admissions
Oct 21, 2026
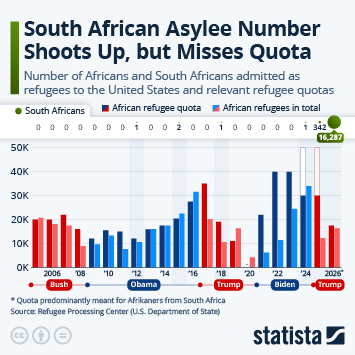
This chart shows the number of Africans and South Africans admitted as refugees to the United States and relevant refugee quotas.
More Information
Immigration
Oct 21, 2026
This chart shows the share of respondents in selected countries who think immigration is one of the biggest issues.
More Information
Refugees in the U.S.
Oct 21, 2026
This chart shows the number of asylum grantees in the U.S. from FY1975-FY2026, by region of origin.
More Information
Climate Change
Oct 20, 2026
This chart shows the share of respondents in selected countries who think climate change is one of the biggest issues in their country.
More Information
Carbon Capture
Oct 20, 2026
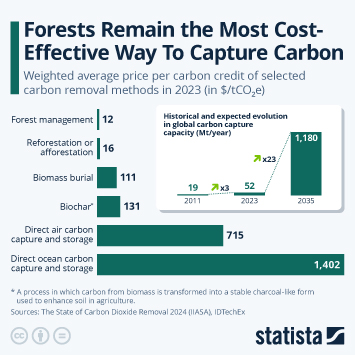
This infographic shows the weighted average price per carbon credit of selected carbon removal methods in 2025.
More Information
Carbon Capture
Oct 20, 2026
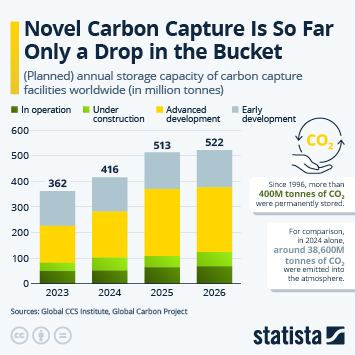
This chart shows (planned) annual storage capacity of carbon capture facilities worldwide.
More Information
Self-Checkout
Oct 19, 2026
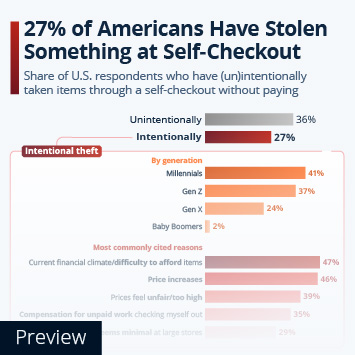
This chart shows the share of U.S. respondents who have (un)intentionally taken items through a self-checkout without paying.
More Information
Self-Checkout
Oct 19, 2026
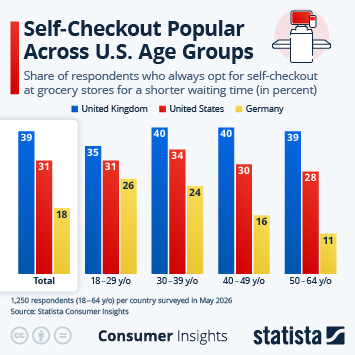
This chart shows the share of respondents who always opt for self-checkout at grocery stores for a shorter waiting time.
More Information
Federal Executions
Oct 19, 2026
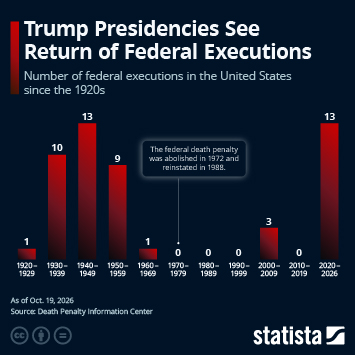
This chart shows the number of federal executions in the United States since the 1920s.
More Information
AI
Oct 16, 2026
This chart shows the share of respondents who say they are open to using AI-based tools for budgeting/investments/financial planning.
More Information
Investments
Oct 16, 2026
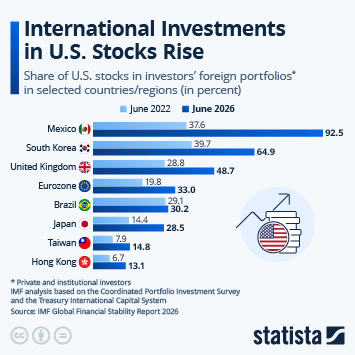
This chart shows the share of U.S. stocks in investors' portfolios in selected countries/regions.
More Information
Car Models
Oct 15, 2026
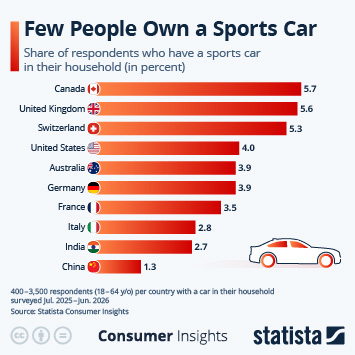
This chart shows the share of respondents who have a sports car in their household.
More Information
Electric Vehicles
Oct 15, 2026
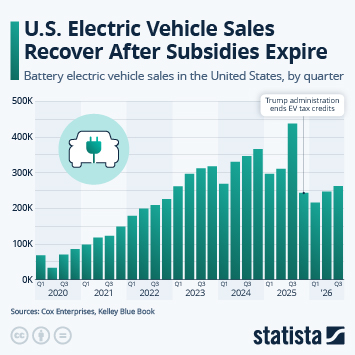
This chart shows battery electric vehicle sales in the United States.
More Information
Tesla
Oct 15, 2026
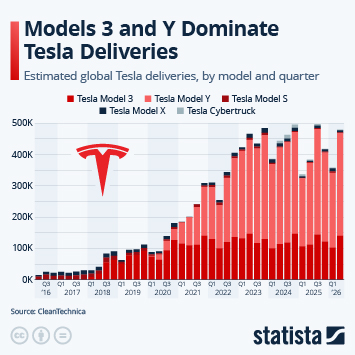
This chart shows estimated global Tesla deliveries, by model and quarter.
More Information
Pharmaceutical Industry
Oct 14, 2026
This chart shows the estimated sales revenues of different classes of drugs in 2026 and 2031.
More Information
IMF Forecast
Oct 14, 2026
This chart shows the forecast for real GDP growth in the world's largest economies in 2026.
More Information
Pharmacies
Oct 14, 2026
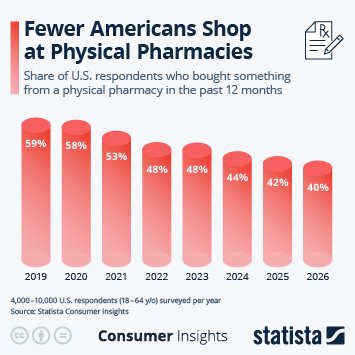
This chart shows the share of U.S. respondents who bought something from a physical pharmacy in the past 12 months.
More Information
2
/
161
Contact
Get in touch with us. We are happy to help.
Do you still have questions?
Feel free to contact us anytime using our
contact form
or visit our
FAQ page
.
Your contact to the Infographics Newsroom
Felix Richter
Data Journalist
felix.richter@statista.com
+49 (40) 284 841 557