Skip to main content
Consumer Goods & FMCG
E-Commerce
Economy & Politics
Energy & Environment
Health, Pharma & Medtech
Internet
Media
Technology & Telecommunications
Transportation & Logistics
Travel, Tourism & Hospitality
View all industries
Global data volume growth
Global AI market size
Number of generative AI users worldwide
Global inflation rate
Retail e-commerce sales worldwide
Largest economies worldwide
Biggest social media platforms by users
Global EV market share by manufacturer
International tourist arrivals by world region
Global annual CO₂ emissions
Browse recent statistics
Artificial intelligence (AI) worldwide
TikTok
Nvidia
E-commerce worldwide
Global GDP
Instagram
Apparel market worldwide
Video gaming worldwide
Global renewable energy industry
Influencer marketing worldwide
Browse recent topics
Consumer Trends 2026
Artificial Intelligence: in-depth market analysis
E-commerce challenges
Global economy
TikTok
Luxury goods: in-depth market analysis
Electric vehicles: A global overview
Video gaming worldwide
Travel and tourism trends 2026
Battery recycling worldwide
Browse recent reports
Explore the tool
Explore Classic mode
Advertising & Media
eCommerce
Consumer
Finance
Global Indicators
Health
Industrial
Mobility
Technology
Explore Market Insights
eCommerce Insights
Research AI
Book a demo
All integrations
Developer docs
Explore Statista Connect
Research
Strategy & Consulting
Marketing
Media & PR
Explore AI assistants
Marketing
Research & Development
Strategy
Sales
Find the fact
Tell the story
Win the pitch
Understand the market
Develop your strategy
Academia
Agencies
Consultancies
Consumer goods
Finance
Tech
Research solutions
Strategy consulting
Communication services
Explore Statista+
Statista R
Statista Healthcare
About Statista
First steps & help center
Webinar & training hub
Success stories
Individuals & Small Teams
Businesses & Enterprises
Academia & Government
English
Deutsch
Daily Data
Global stories vividly visualized
Oct 10, 2012
This chart shows Zynga's stock performance since the company's IPO on December 16, 2011.
More Information
Oct 8, 2012
This chart shows key metrics of social media channels as a source of e-commerce traffic. The averages are based on data from 689 million...
More Information
Oct 6, 2012
This chart shows the quarterly bookings of social gaming giant Zynga.
More Information
Oct 5, 2012
This chart shows the incredible growth of Facebook's user base.
More Information
Oct 4, 2012
This chart shows how news consumption in the United States has changed over the past two decades.
More Information
Oct 2, 2012
This chart shows the share of Android devices running Ice Cream Sandwich.
More Information
Oct 2, 2012
The graphic shows the market capitalisation of Microsoft and Google.
More Information
Oct 1, 2012
The graphic shows the share of blocked malware-infected websites by browser.
More Information
Sep 26, 2012
This chart shows the results of a survey among American consumers regarding their mobile shopping behaviour.
More Information
Sep 25, 2012
This chart shows estimated global IP traffic per month in Exabyte. One exabyte equals one billion gigabytes.
More Information
Sep 24, 2012
This chart shows global tablet shipments in 2011 and a forecast for 2012 and 2016.
More Information
Sep 21, 2012
This chart shows estimated display advertising revenue of major digital ad-selling companies in the United States.
More Information
Sep 20, 2012
This chart provides a breakdown of unique visitors to online retail sites, by device and household income.
More Information
Sep 19, 2012
This chart shows pre-orders and three-day launch weekend sales of Apple's iPhone 4, 4S and 5.
More Information
Sep 18, 2012
This chart shows the total number of music releases downloaded via BitTorrent in the first half of 2012.
More Information
Sep 17, 2012
This chart shows the growth and collapse of newspaper advertising in the United States from 1950 to 2012. All numbers are adjusted...
More Information
Sep 14, 2012
This chart shows the change of Apple's stock price after major product announcements.
More Information
Sep 13, 2012
This chart shows Twitter's estimated global advertising revenue from 2010 to 2014.
More Information
Sep 12, 2012
This chart shows the market share of leading TV manufacturers in the global flat-panel TV market.
More Information
Sep 7, 2012
This chart shows second quarter advertising revenue of U.S. newspapers since 2003.
More Information
Sep 6, 2012
Today's chart shows estimated mobile advertising revenues in the United States.
More Information
Sep 5, 2012
This chart shows Verizon’s wireless data revenue as a percentage of total wireless service revenue.
More Information
Sep 4, 2012
This chart shows the price to earnings ratio for selected tech companies.
More Information
Sep 3, 2012
This chart shows the five largest smartphone markets, based on their share of global smartphone shipments.
More Information
Sep 1, 2012
This chart shows Facebook's revenue from 2009 through 2013. The values for 2012 and 2013 represents eMarketer estimates.
More Information
Aug 31, 2012
This chart shows the reason why facebook needs mobile ads: More than 100 million users access the site from mobile devices only.
More Information
Aug 30, 2012
The chart shows the stock performance of Facebook since its IPO in May 2012.
More Information
Aug 28, 2012
This chart shows the largest markets for smart devices, based on the number of active iOS and Android devices in July 2012.
More Information
Aug 28, 2012
This chart shows the year-over-year change of active smart devices in the fastest-growing markets.
More Information
Aug 27, 2012
The chart shows the results of a survey among U.S. marketing and advertising executives regarding their company's attitude toward Pinterest.
More Information
Aug 24, 2012
This chart compares Apple's stock performance in the first 12 months under CEOs Steve Jobs and Tim Cook.
More Information
Aug 23, 2012
This chart shows which improvements are the most wanted by mobile device users across five countries.
More Information
Aug 22, 2012
This chart shows the amount of money spend on apps by Android and iOS users.
More Information
Aug 21, 2012
This chart shows the results of a survey among Americans regarding their media use. Those polled were asked which media or devices...
More Information
Aug 20, 2012
This chart shows the estimated annual change in global music revenues, broken down by type.
More Information
Aug 17, 2012
This chart shows the net profit margins of Apple and Samsung.
More Information
Aug 17, 2012
This chart shows Facebook users as a percentage of total internet users in different world regions.
More Information
Aug 16, 2012
This chart shows the global installed base of smartphones, broken down by operating system. All values represent estimates as of Q2...
More Information
Aug 10, 2012
This chart shows Android's share of smartphone sales in EU5 countries.
More Information
Aug 9, 2012
This chart shows the top 10 Olympic athletes with the most fans/followers on Facebook and Twitter.
More Information
Aug 7, 2012
This chart shows Apple's exceptional position in the global mobile phone industry.
More Information
Aug 6, 2012
This chart shows net subscriber additions of the largest U.S. pay TV providers and Netflix in the second quarter of 2012.
More Information
Aug 3, 2012
This chart shows this year's stock performance of internet companies that recently went public, namely LinkedIn, Groupon, Zynga and...
More Information
Aug 2, 2012
This graphic displays the public debt outstanding in the United States from 1990 to 2011. In the period covered here, the U.S. public...
More Information
Aug 2, 2012
This chart shows the time it took selected technologies and services to reach 50 million users worldwide.
More Information
Aug 1, 2012
This infographic display the average daily consumer spending in the United States. Consumer spending is reported on a monthly basis...
More Information
Jul 31, 2012
This chart shows Netflix's stock performance since July 2011.
More Information
Jul 27, 2012
This chart illustrates that Zynga's average bookings per monthly unique user are on a downward-slope, having declined year-over-year...
More Information
Jul 27, 2012
This chart shows advertising revenue growth of Facebook and Google prior to and immediately after going public.
More Information
Jul 25, 2012
This chart shows cumulative iPad and iPhone sales in the first nine quarters after their respective market debut.
More Information
Jul 24, 2012
This chart shows the Top 10 spam-relaying countries from April through June 2012.
More Information
Jul 23, 2012
This chart shows the cumulative distribution of broadband traffic per user in the U.S. in April 2012, by broadband technology.
More Information
Jul 23, 2012
This chart shows the growth of the number of registered top-level domains in the past 5 years.
More Information
Jul 20, 2012
The chart shows the profit/loss of Microsoft since 1992.
More Information
Jul 18, 2012
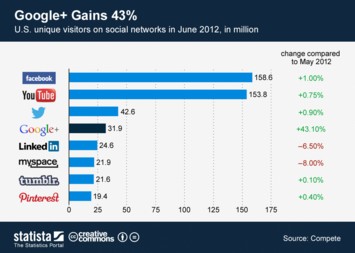
The chart shows U.S. unique visitors on social networks in June 2012.
More Information
Jul 17, 2012
This chart shows how U.S. internet companies that went public in 2011 or 2012 have performed on the stock market thus far.
More Information
Jul 17, 2012
The chart shows the iPhone share of Apple's revenue.
More Information
Jul 16, 2012
The chart shows the global market share of PC Vendors in Q2 2009 and Q2 2012.
More Information
Jul 13, 2012
The chart shows the iPhone sales since 2007 and the range of estimates for the second quater of 2012.
More Information
Jul 13, 2012
The chart shows which channels where used for investment transactions by respondents of the survey in the last three months.
More Information
Jul 12, 2012
The chart shows the iPad sales until March 2012 and the range of estimates for the second quater of 2012.
More Information
Jul 11, 2012
The chart shows the worldwide advertising expenditure year over year change in Q1 2012.
More Information
Jul 10, 2012
The Chart shows the worldwide IT Spending since 1999.
More Information
Jul 9, 2012
The infographic shows eBay’s revenue since 2003 in billion U.S. dollars.
More Information
Jul 6, 2012
This chart shows Samsung's quarterly operating profit.
More Information
Jul 4, 2012
This chart shows the market share of Windows Phone in the U.S. smartphone market since May 2011.
More Information
Jul 3, 2012
This chart shows that app developers are increasingly focused on developing for Android and iOS, while other platforms are gradually...
More Information
Jul 1, 2012
This chart shows global market share of the world's leading web browsers since September 2008.
More Information
Jun 26, 2012
This chart shows that, thanks to Amazon's Kindle Fire, Android is closing the gap on iOS in the U.S. tablet market.
More Information
159
/
161
Contact
Get in touch with us. We are happy to help.
Do you still have questions?
Feel free to contact us anytime using our
contact form
or visit our
FAQ page
.
Your contact to the Infographics Newsroom
Felix Richter
Data Journalist
felix.richter@statista.com
+49 (40) 284 841 557