Skip to main content
Consumer Goods & FMCG
E-Commerce
Economy & Politics
Energy & Environment
Health, Pharma & Medtech
Internet
Media
Technology & Telecommunications
Transportation & Logistics
Travel, Tourism & Hospitality
View all industries
Global data volume growth
Global AI market size
Number of generative AI users worldwide
Global inflation rate
Retail e-commerce sales worldwide
Largest economies worldwide
Biggest social media platforms by users
Global EV market share by manufacturer
International tourist arrivals by world region
Global annual CO₂ emissions
Browse recent statistics
Artificial intelligence (AI) worldwide
TikTok
Nvidia
E-commerce worldwide
Global GDP
Instagram
Apparel market worldwide
Video gaming worldwide
Global renewable energy industry
Influencer marketing worldwide
Browse recent topics
Consumer Trends 2026
Artificial Intelligence: in-depth market analysis
E-commerce challenges
Global economy
TikTok
Luxury goods: in-depth market analysis
Electric vehicles: A global overview
Video gaming worldwide
Travel and tourism trends 2026
Battery recycling worldwide
Browse recent reports
Explore the tool
Explore Classic mode
Advertising & Media
eCommerce
Consumer
Finance
Global Indicators
Health
Industrial
Mobility
Technology
Explore Market Insights
eCommerce Insights
Research AI
Book a demo
All integrations
Developer docs
Explore Statista Connect
Research
Strategy & Consulting
Marketing
Media & PR
Explore AI assistants
Marketing
Research & Development
Strategy
Sales
Find the fact
Tell the story
Win the pitch
Understand the market
Develop your strategy
Academia
Agencies
Consultancies
Consumer goods
Finance
Tech
Research solutions
Strategy consulting
Communication services
Explore Statista+
Statista R
Statista Healthcare
About Statista
First steps & help center
Webinar & training hub
Success stories
Individuals & Small Teams
Businesses & Enterprises
Academia & Government
English
Deutsch
Daily Data
Infographics on the topic "china"
25 years after 9/11
Sep 11, 2026
This chart shows the costliest disasters worldwide by insured losses.
More Information
Shein IPO
Aug 31, 2026
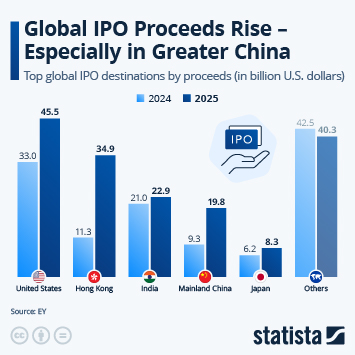
This chart shows top global IPO destinations by proceeds.
More Information
Unemployment
Aug 26, 2026
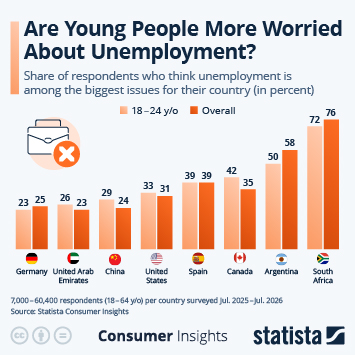
This chart shows the share of respondents who think unemployment is among the biggest issues for their country.
More Information
Video Games
Aug 25, 2026
This chart shows adults video game playing behavior in selected countries in 2025/26.
More Information
Cross-border e-commerce
Aug 14, 2026
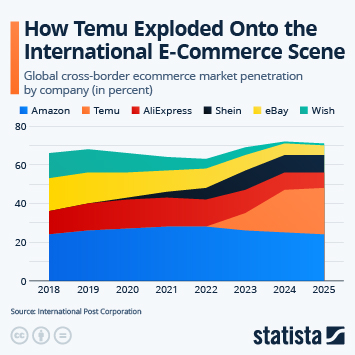
This chart shows the share of global cross-border ecommerce by company.
More Information
Sponsored post by Booking.com
Aug 14, 2026
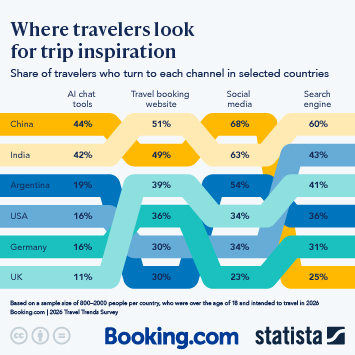
This infographic shows the share of travelers who use social media to plan their trips.
More Information
Ammunitions
Aug 10, 2026
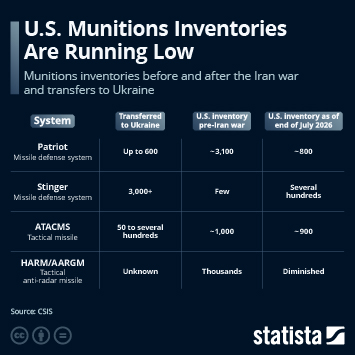
This chart shows munitions inventories before and after the Iran war and transfers to Ukraine.
More Information
Defense
Aug 10, 2026
This chart shows the share of respondents who say the issue of defense and foreign affairs is among the most important for their country.
More Information
Sponsored post by Booking.com
Aug 7, 2026
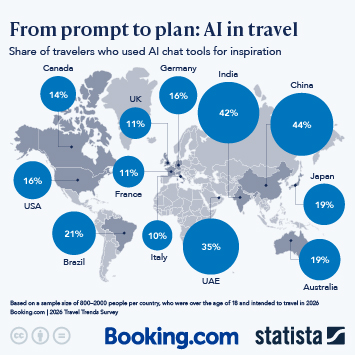
This infographic shows the share of travelers who use generative AI to plan their trips, by country.
More Information
Beer
Aug 7, 2026
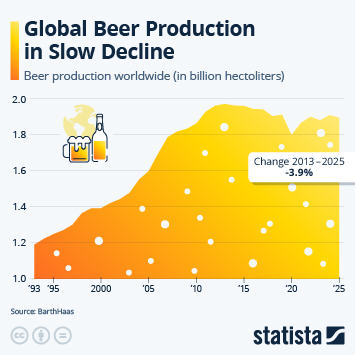
This chart shows beer production worldwide.
More Information
Beer
Aug 7, 2026
This chart shows the countries with the highest beer output volume in 2025.
More Information
Beer consumption
Aug 7, 2026
This chart shows the share of respondents per country who regularly drink beer.
More Information
Satellite Internet
Aug 5, 2026
This chart shows the share of respondents from selected countries who use satellite internet at home.
More Information
Satellite Internet
Aug 5, 2026
This chart shows countries by availability of Starlink satellite internet (as of August 2026).
More Information
Hot beverages
Aug 4, 2026
This chart shows the share of respondents in selected countries who regularly drink tea and/or coffee.
More Information
Robotics
Aug 3, 2026
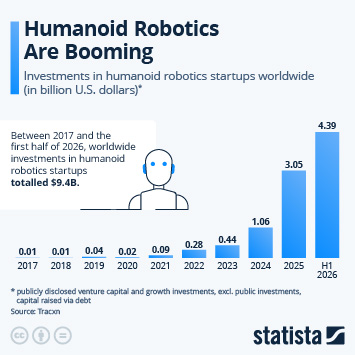
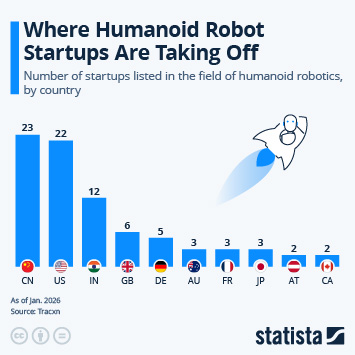
This chart shows investments in humanoid robotics startups worldwide.
More Information
Robotics
Aug 3, 2026
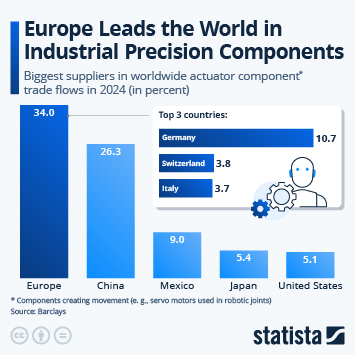
This chart shows the biggest suppliers in worldwide actuator component trade flows in 2024.
More Information
AI Robotics
Aug 3, 2026
This chart shows total investments in humanoid robotics startups by country from 2017 until H1 2026.
More Information
Artificial Intelligence
Jul 27, 2026
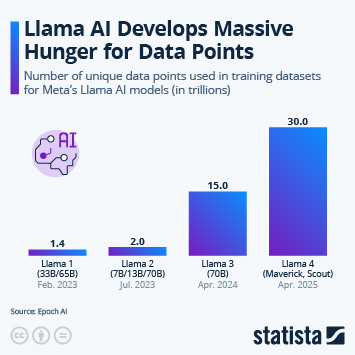
This chart shows the Number of unique data points used in training datasets for Meta's Llama AI models.
More Information
Electric Vehicles
Jul 23, 2026
This chart shows the automotive gross margin of Tesla from Q1 2021 to Q2 2026.
More Information
Iran War
Jul 21, 2026
This chart shows the daily price per barrel of Brent crude oil since January 2008.
More Information
Population
Jul 10, 2026
This chart shows the number of people on Earth and the annual growth rate of the world population from 1950 to 2100.
More Information
Population Decline
Jul 10, 2026
This chart shows when selected countries' populations are expected to start declining.
More Information
Nike
Jul 9, 2026
This chart shows Nike's global sales since 1976.
More Information
Sponsored post by Booking.com
Jul 9, 2026
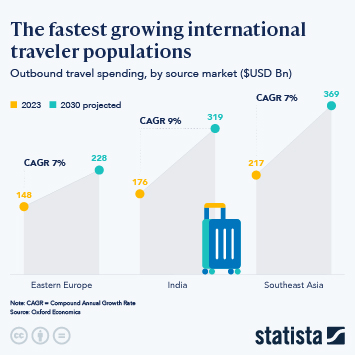
This infographic shows the outbound traveler spending of three of the fastest growing source markets.
More Information
Foreign direct investment
Jul 8, 2026
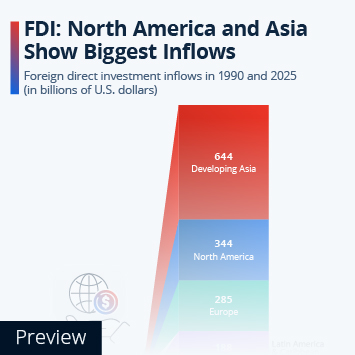
This chart shows foreign direct investment inflows in 1990 and 2025.
More Information
Data center power demand
Jul 2, 2026
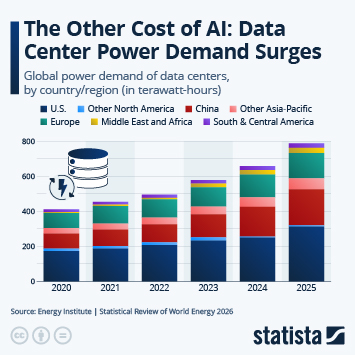
This chart shows the steady rise in global data center electricity demand.
More Information
Battery storage
Jul 2, 2026
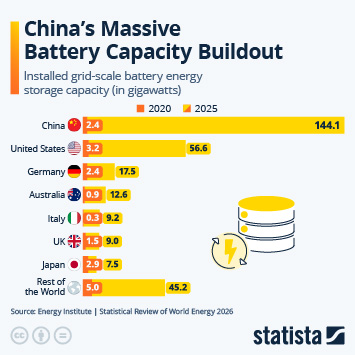
This chart shows installed grid-scale battery energy storage capacity.
More Information
Renewable Energy
Jul 2, 2026
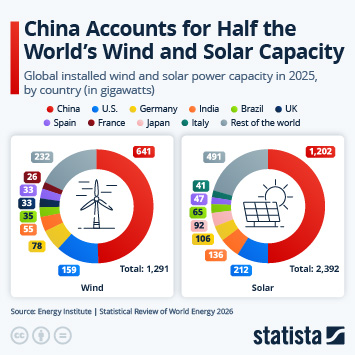
This chart shows global installed wind and solar power capacity by country as of 2025.
More Information
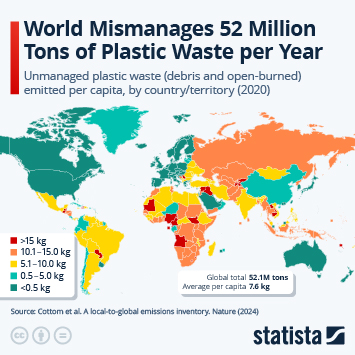
Plastic Waste
Jul 1, 2026
This chart shows mismanaged plastic waste emitted per capita and year, by country/territory.
More Information
2
/
23
Contact
Get in touch with us. We are happy to help.
Do you still have questions?
Feel free to contact us anytime using our
contact form
or visit our
FAQ page
.
Your contact to the Infographics Newsroom
Felix Richter
Data Journalist
felix.richter@statista.com
+49 (40) 284 841 557