Skip to main content
Consumer Goods & FMCG
E-Commerce
Economy & Politics
Energy & Environment
Health, Pharma & Medtech
Internet
Media
Technology & Telecommunications
Transportation & Logistics
Travel, Tourism & Hospitality
View all industries
Global data volume growth
Global AI market size
Number of generative AI users worldwide
Global inflation rate
Retail e-commerce sales worldwide
Largest economies worldwide
Biggest social media platforms by users
Global EV market share by manufacturer
International tourist arrivals by world region
Global annual CO₂ emissions
Browse recent statistics
Artificial intelligence (AI) worldwide
TikTok
Nvidia
E-commerce worldwide
Global GDP
Instagram
Apparel market worldwide
Video gaming worldwide
Global renewable energy industry
Influencer marketing worldwide
Browse recent topics
Consumer Trends 2026
Artificial Intelligence: in-depth market analysis
E-commerce challenges
Global economy
TikTok
Luxury goods: in-depth market analysis
Electric vehicles: A global overview
Video gaming worldwide
Travel and tourism trends 2026
Battery recycling worldwide
Browse recent reports
Explore the tool
Explore Classic mode
Advertising & Media
eCommerce
Consumer
Finance
Global Indicators
Health
Industrial
Mobility
Technology
Explore Market Insights
eCommerce Insights
Research AI
Book a demo
All integrations
Developer docs
Explore Statista Connect
Research
Strategy & Consulting
Marketing
Media & PR
Explore AI assistants
Marketing
Research & Development
Strategy
Sales
Find the fact
Tell the story
Win the pitch
Understand the market
Develop your strategy
Academia
Agencies
Consultancies
Consumer goods
Finance
Tech
Research solutions
Strategy consulting
Communication services
Explore Statista+
Statista R
Statista Healthcare
About Statista
First steps & help center
Webinar & training hub
Success stories
Individuals & Small Teams
Businesses & Enterprises
Academia & Government
English
Deutsch
Daily Data
Infographics on the topic "presidential election"
State Cars
Aug 2, 2018
This chart shows official state cars by model, price and country of origin (selected leaders).
More Information
Twitter Trolls
Aug 1, 2018
This chart shows Russian troll tweets associated with the Internet Research Agency by category.
More Information
FBI
Jul 31, 2018
This chart shows the percent of survey respondents who viewed the FBI favorably by partisanship.
More Information
Mueller Investigation
Jul 23, 2018
This chart shows public support for the Mueller investigation from May 2017 to June 2018.
More Information
2020 Election
Jul 18, 2018
This chart shows total fundraising for 2020 Trump campaign, January 2017-July 2018.
More Information
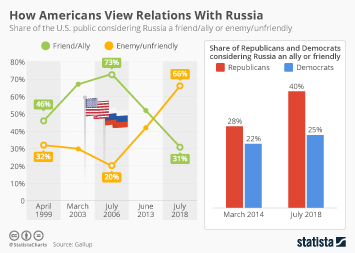
Trump & Russia
Jul 17, 2018
This chart shows the share of the U.S. public considering Russia a friend/ally or enemly/unfriendly.
More Information
U.S./Russia Summit
Jul 16, 2018
This chart shows what the U.S. public thinks Trump should discuss with Putin in there July 16 meeting.
More Information
Turkey
Jun 25, 2018
This chart shows Recep Tayyip Erdogan in power as prime minister or president of Turkey
More Information
Facebook
May 11, 2018
This chart shows how Facebook's share price developed through the first months of 2018.
More Information
Facebook
May 8, 2018
This chart shows how and if U.S. Facebook users have recently changed how frequently they use the social media platform.
More Information
Brazil
Apr 3, 2018
This chart shows responses to the question: "should Luiz Inácio Lula da Silva be arrested/allowed to run in the election?"
More Information
Techlash
Mar 21, 2018
This chart shows how people think the net impact of major tech companies on society will be judged ten years from now.
More Information
Vladimir Putin
Mar 14, 2018
This chart shows the share confident about Putin doing the right thing regarding world affairs (Aug '17).
More Information
Confectionery
Feb 5, 2018
This chart shows the changes in weight and price of selected confectionery from 2014 to 2018 in the UK.
More Information
Iran Protests
Jan 3, 2018
This chart shows the annual jump in the price of basic goods in Iran.
More Information
Mueller Investigation
Dec 8, 2017
This chart shows the public's views on Robert Mueller's investigation into the Trump administration's alleged ties to Russia.
More Information
Internet Freedom
Nov 14, 2017
This chart shows the prevalence of manipulation tactics on social media in 65 countries.
More Information
Donald Trump
Nov 6, 2017
This chart shows the disapproval/approval of U.S. presidents during their first November in office.
More Information
German Election 2017
Sep 25, 2017
This chart shows the results of major General/Presidential Elections in Europe 2017.
More Information
Literature
Sep 18, 2017
This chart shows the share of selected politicians' audiobooks completed by listeners on average
More Information
UK
Jul 24, 2017
This chart shows the number of products on sale in the UK that have changed in size from January 2012 to June 2017, by type.
More Information
Donald Trump
Jun 28, 2017
This chart shows the share of people confident in the U.S president doing the right thing globally (%).
More Information
U.S. Politics
Jun 20, 2017
This chart shows the popularity of potential 2020 Democratic candidates.
More Information
Trump/Russia
Jun 14, 2017
This chart shows American opinions on the connections between the Trump campaign and Russia.
More Information
Voter Turnout
Jun 13, 2017
This chart shows voter turnout in selected nations in their most recent election.
More Information
Corruption In Russia.
Jun 12, 2017
This chart shows Russian attitudes towards high-level government corruption.
More Information
French Election
Jun 12, 2017
This chart shows the share of total votes in the first round of parliamentary elections in France in 2017.
More Information
Comey Testimony
Jun 8, 2017
This chart shows responses to the question: "how much do you trust Trump/Comey on Russian interference in the 2016 election?"
More Information
Global Peace Index 2017
Jun 6, 2017
This chart shows countries by ranked by peace level in 2017.
More Information
Global Peace Index
Jun 1, 2017
This chart shows countries ranked by peace level in 2017.
More Information
Internet
May 24, 2017
This chart shows a distribution of referral traffic sources, by article topic.
More Information
U.S. Politics
May 17, 2017
This chart shows the share of registered voters very/somewhat concerned about Trump scandals in October 2016.
More Information
Comey Firing
May 11, 2017
This chart shows lawmakers' reaction in the aftermath of Comey's firing.
More Information
French Presidential Election
May 8, 2017
This chart shows the winner of each deparement in the second round of the French presidential election.
More Information
French Election
May 8, 2017
This chart shows a distribution of registered voters in the second round of the French presidential election 2017.
More Information
French Election
May 8, 2017
This chart shows the second round results of the French presidential election 2017.
More Information
French Election
May 5, 2017
This chart shows selected results of a post-TV debate survey on 3 May 2017.
More Information
U.S. Politics
May 4, 2017
This chart shows the percentage of U.S. workers who have experienced the following since the 2016 election.
More Information
U.S. Politics
Apr 28, 2017
This chart shows the approval rating of President Trump as seen by his voters and those that voted for Clinton.
More Information
French Election
Apr 24, 2017
This chart shows the winner of each department in the first round of the French presidential election.
More Information
French Presidential Election
Apr 24, 2017
This chart shows second round voting intention in the French presidential election.
More Information
French Election
Apr 24, 2017
This chart shows the share of votes received by candidates in the first round of the French presidential election 2017.
More Information
French Election
Apr 21, 2017
This chart compares survey responses of Front National voters in 1997 and 2017.
More Information
2016 Election
Apr 19, 2017
Total spent on congressional/presidential races (actual dollars).
More Information
Digital news subscriptions
Apr 6, 2017
This chart shows the number of paid digital-only subscribers of selected U.S. newspapers and news publishing groups.
More Information
France
Apr 4, 2017
This chart shows voting intention for the 2017 French election.
More Information
Election Demographics
Mar 27, 2017
This chart shows the population residing in counties carried by respective presidential candidates (in millions)
More Information
French Presidential Election
Mar 22, 2017
This chart shows first round voting intention in the French election.
More Information
Donald Trump
Feb 21, 2017
This chart shows the percent of the electoral college vote won by presidents since Reagan.
More Information
Online News Consumption
Feb 21, 2017
This chart shows total mobile and desktop visits for selected U.S. online news sites (in millions)
More Information
Book Sales
Feb 15, 2017
This chart shows best-selling books in the U.S. in the 2nd Week of February 2017
More Information
Inauguration Day
Jan 20, 2017
This chart shows the amount of donations raised for the inauguration of selected U.S. presidents (in $m)
More Information
Inauguration Day
Jan 20, 2017
This chart shows percent of Americans who plan(ned) to watch inaugurations of selected U.S. presidents
More Information
Inauguration Day
Jan 20, 2017
This chart shows followers of selected Twitter accounts worldwide as of Jan. 20, 2017 (in millions)
More Information
Politics & Finances
Jan 10, 2017
This chart shows the change in value of foreign currencies against the U.S. Dollar since Trump's election on Nov. 8, 2016 to Jan 2017
More Information
Obama's Legacy
Jan 10, 2017
This chart shows selected economic parameters at beginning and end of Barack Obama's presidency (2009-2017)
More Information
Faith & Politics
Jan 5, 2017
This chart shows changes in the religious make-up of the U.S. Congress 1961 to 2017
More Information
Transition of Power
Jan 4, 2017
This chart shows a comparison of how confident Americans are in Trump to handle presidential responsibilities compared to previous...
More Information
Public opinion on fake news
Dec 20, 2016
This chart shows what Americans think about the fake news problem.
More Information
U.S. Elections
Dec 13, 2016
This chart shows what the world thought who would win the U.S. elections 2016 (selected countries)
More Information
Electoral Economics
Dec 5, 2016
This chart shows the number and combined GDP of counties which either voted Democratic or Republican in the presidential elections...
More Information
Presidential Election
Dec 5, 2016
This chart gives a breakdown of voting in the Austrian presidential election on December 4, 2016.
More Information
France 2017
Nov 28, 2016
This chart shows the result of a voting intention poll for the French presidential election 2017.
More Information
U.S. Presidential Election
Nov 28, 2016
This chart shows elections in which the elected U.S. President didn’t get the greater share of the popular vote but won the electoral...
More Information
Election 2016
Nov 24, 2016
This chart shows what UK survey respondents think will happen with Trump as US President.
More Information
Election 2016
Nov 23, 2016
This chart shows the number of votes received by the two main candidates in three key election 2016 states.
More Information
Facebook
Nov 17, 2016
This chart shows the Facebook engagement of fake news stories on the US election 2016.
More Information
Calexit
Nov 17, 2016
This chart shows the estimated GDP in countries/territories in 2015.
More Information
Wages and Salary
Nov 16, 2016
This chart shows the annial salary of selected world leaders in 2016.
More Information
2016 Election
Nov 15, 2016
This chart shows national adults' reactions to the presidential election (Nov 9).
More Information
2016 Election
Nov 14, 2016
This chart shows total votes cast by voters across the United States in presidential elections.
More Information
Politics
Nov 14, 2016
This chart shows the % of people "not at all interested in politics" in selected countries.
More Information
Election 2016
Nov 11, 2016
This chart compares international markets after the first full day of trading following Brexit and the 2016 U.S. election.
More Information
Election 2016
Nov 11, 2016
This chart shows voting age population turnout in the most recent national election of selected countries.
More Information
Election
Nov 10, 2016
This chart shows US election voter share by race.
More Information
U.S. Elections 2016
Nov 10, 2016
The graphic shows how Trump and Clinton voters strongly disagree on key issues discussed during the U.S. election campaigns 2016.
More Information
Election 2016
Nov 10, 2016
This chart looks at in which demographic groups each candidate was the most successful.
More Information
Election Fraud
Nov 9, 2016
This chart shows responses to the question "How much fraud do you think there is in American elections?"
More Information
2016 Election
Nov 9, 2016
This chart shows US voter share by age.
More Information
U.S. Election
Nov 9, 2016
This chart shows the preliminary results for the United States presidential election Nov. 8, 2016
More Information
2016 Election
Nov 9, 2016
This chart shows the percentage of US adults who rated the following presidential candidates unfavourable.
More Information
Stock market reaction to U.S. election result
Nov 9, 2016
This chart shows stock prices of major technology companies reacted to Donald Trump's victory in the U.S. presidential election.
More Information
Election 2016
Nov 8, 2016
This chart shows the percentage chance of winning by candidate in US states.
More Information
Election 2016
Nov 8, 2016
This chart shows the results of the final polls in the 2016 US election.
More Information
Voter Turnout
Nov 8, 2016
This chart shows voter turnout in selected developed nations' most recent election (% of voting age population)
More Information
US Election
Nov 8, 2016
This chart looks back at the final polls of US Presidential elections from 1976 to 2012.
More Information
2016 Election
Nov 7, 2016
This chart shows the percentage of adults who would be afraid if Trump or Clinton was elected president.
More Information
US 2016
Nov 7, 2016
This chart looks at the size and voting patterns of the millennial generation in the US electorate as of 2016.
More Information
U.S. Elections
Nov 7, 2016
This chart shows national leaders Republicans and Democrats dislike most
More Information
U.S. Election
Nov 4, 2016
This chart shows the frequency of specific insults used in tweets by Donald Trump directed at his rival Hillary Clinton
More Information
6
/
7
Contact
Get in touch with us. We are happy to help.
Do you still have questions?
Feel free to contact us anytime using our
contact form
or visit our
FAQ page
.
Your contact to the Infographics Newsroom
Felix Richter
Data Journalist
felix.richter@statista.com
+49 (40) 284 841 557