The electoral college, the system by which the President of the United States is not directly voted for by the public, but rather by a go-between elector, was invented by the Founding Fathers as a safeguard against democracy going wrong. The electors, whose number in each state equals the sum of its U.S. senators and its U.S. representatives, come together after the election to officially vote the president into office.
The electors for the 2016 Presidential election are convening on Monday, Dec 19, 2016, in their respective states to cast their votes for the president and the vice president in seperate ballots. They are not bound by federal law to how the public voted and therefore could vote for any candidate, though some states do require the electors to stick to the public's vote and can impose fines on so-called "faithless electors".
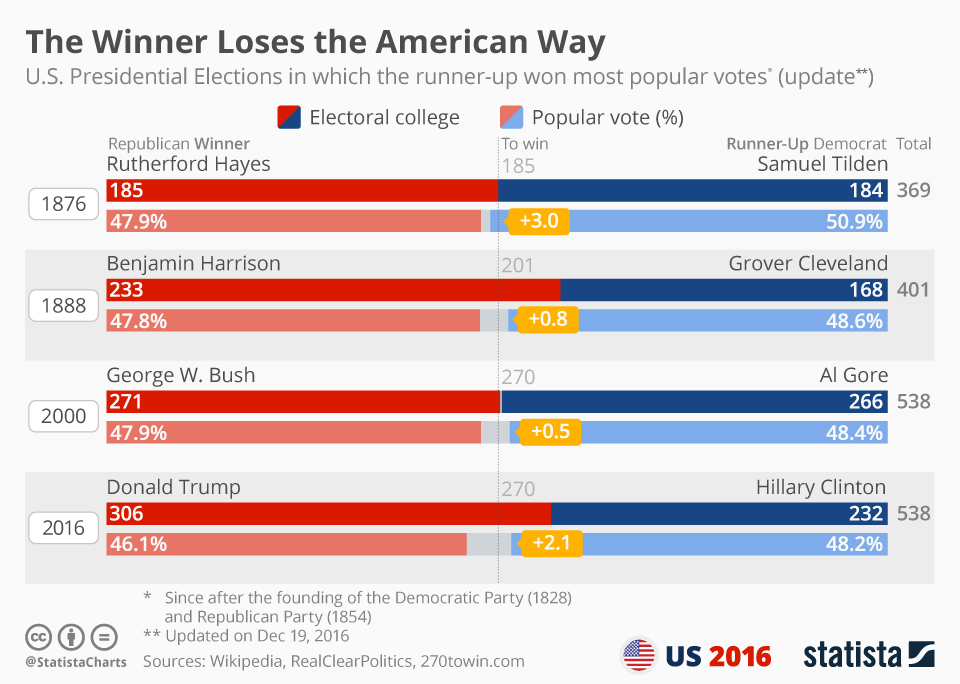
Since the founding of the modern day Democratic Party and its Republican counterpart there have been four instances in which the elected President won the electoral college but didn’t get the bigger share in the popular vote. In the most recent election, Hillary Clinton won approximately 2.9 million more votes (amounting to a 2.1 percent margin) than the official winner Donald Trump, who got a sound majority of the electoral vote.
As our updated chart shows, in all instances it were Republican candidates who won the presidency despite losing the popular vote. Back in 2012 Trump tweeted: "The electoral college is a disaster for a democracy." So, the system which Trump on various occasions during his election campaign called rigged actually helped him to get elected in the end.
Elections in Which the President Didn't Get the Most Votes
U.S. Presidential Election

Description
This chart shows elections in which the elected U.S. President didn’t get the greater share of the popular vote but won the electoral college (updated from Nov 28, 2016)


