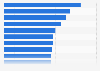
Attendance at Disney theme parks in the United States from 2019 to 2021, by park (in millions)
Basic Account
Get to know the platform
You only have access to basic statistics.
This statistic is not included in your account.
Starter Account
The ideal entry-level account for individual users
- Instant access to 1m statistics
- Download in XLS, PDF & PNG format
- Detailed references
$59 USD $39 USD / Month *
in the first 12 months
Professional Account
Full access
Corporate solution including all features.
* Prices do not include sales tax.
Statistics on Amusement and theme parks
Attendance
6
- Premium Statistic Top amusement park chains worldwide by visitation 2019
- Basic Statistic Most visited amusement and theme parks worldwide 2019-2021
- Premium Statistic Most visited amusement and theme parks in North America 2021
- Premium Statistic Most visited amusement and theme parks in Europe 2019-2021
- Basic Statistic Most visited amusement and theme parks APAC 2019-2021
- Premium Statistic Most visited Latin American amusement and theme parks 2019-2021
Revenue of industry leaders
6
- Basic Statistic Revenue of the Walt Disney Company in 2022, by operating segment
- Premium Statistic Merlin Entertainments revenue 2010-2021
- Premium Statistic Legoland revenue worldwide 2011-2021
- Premium Statistic SeaWorld revenue 2010-2021
- Premium Statistic Revenue of Six Flags Entertainment in North America 2010-2021
- Premium Statistic Revenue of Cedar Fair Entertainment in North America 2010-2021
Waterparks
4
Roller coasters
4
Further related statistics
18
- Walt Disney World Magic Kingdom theme park attendance 2009-2021
- Walt Disney World Animal Kingdom theme park attendance 2009-2021
- Walt Disney World Epcot theme park attendance 2009-2021
- Top amusement and theme park groups worldwide 2021, by revenue
- Theme parks land area in China 2015
- Regional distribution of planned theme parks in China 2018
- Share of theme parks in operation with recognizable themes in China 2018, by theme
- Regional distribution of theme parks in operation in China 2018
- Distribution of theme parks in China 2017, by adult ticket price
- Distribution of theme parks in China 2017, by visitors annually
- Share of theme parks in operation with recognizable themes in China 2018
- OLC' operating income FY 2011-2021
- Favorability of theme parks in the U.S. 2018
- Tivoli: profit 2009-2021
- American adults theme park attendance interest level as of June 2018
- Attendance to Beach Park 2013-2020
- Walt Disney World Hollywood Studios Florida theme park attendance 2009-2021
- Industry revenue of “amusement and theme parks“ in Georgia 2012-2024
Further Content: You might find this interesting as well
Statistics
- Walt Disney World Magic Kingdom theme park attendance 2009-2021
- Walt Disney World Animal Kingdom theme park attendance 2009-2021
- Walt Disney World Epcot theme park attendance 2009-2021
- Top amusement and theme park groups worldwide 2021, by revenue
- Theme parks land area in China 2015
- Regional distribution of planned theme parks in China 2018
- Share of theme parks in operation with recognizable themes in China 2018, by theme
- Regional distribution of theme parks in operation in China 2018
- Distribution of theme parks in China 2017, by adult ticket price
- Distribution of theme parks in China 2017, by visitors annually
- Share of theme parks in operation with recognizable themes in China 2018
- OLC' operating income FY 2011-2021
- Favorability of theme parks in the U.S. 2018
- Tivoli: profit 2009-2021
- American adults theme park attendance interest level as of June 2018
- Attendance to Beach Park 2013-2020
- Walt Disney World Hollywood Studios Florida theme park attendance 2009-2021
- Industry revenue of “amusement and theme parks“ in Georgia 2012-2024
Themed Entertainment Association. (October 19, 2022). Attendance at Disney theme parks in the United States from 2019 to 2021, by park (in millions) [Graph]. In Statista. Retrieved February 04, 2023, from https://www.statista.com/statistics/227490/disney-world-visitors-orlando-usa/
Themed Entertainment Association. "Attendance at Disney theme parks in the United States from 2019 to 2021, by park (in millions)." Chart. October 19, 2022. Statista. Accessed February 04, 2023. https://www.statista.com/statistics/227490/disney-world-visitors-orlando-usa/
Themed Entertainment Association. (2022). Attendance at Disney theme parks in the United States from 2019 to 2021, by park (in millions). Statista. Statista Inc.. Accessed: February 04, 2023. https://www.statista.com/statistics/227490/disney-world-visitors-orlando-usa/
Themed Entertainment Association. "Attendance at Disney Theme Parks in The United States from 2019 to 2021, by Park (in Millions)." Statista, Statista Inc., 19 Oct 2022, https://www.statista.com/statistics/227490/disney-world-visitors-orlando-usa/
Themed Entertainment Association, Attendance at Disney theme parks in the United States from 2019 to 2021, by park (in millions) Statista, https://www.statista.com/statistics/227490/disney-world-visitors-orlando-usa/ (last visited February 04, 2023)
Attendance at Disney theme parks in the United States from 2019 to 2021, by park (in millions) [Graph], Themed Entertainment Association, October 19, 2022. [Online]. Available: https://www.statista.com/statistics/227490/disney-world-visitors-orlando-usa/