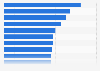
Of the selected companies, Disney Experiences, owned by the Walt Disney Company, was the leading amusement/theme park company worldwide in terms of revenue, generating 33.4 billion U.S. dollars in 2023. Meanwhile, Universal Destinations & Experiences, subsidiary of Comcast Corp., had the second-highest revenue at 8.95 billion U.S. dollars. Both companies were based in the United States.
Leading selected amusement and theme park companies worldwide in 2023, by revenue
(in billion U.S. dollars)
¹ Data for Disney Experiences (The Walt Disney Company) refers to the calendar year 2023 instead of the fiscal year 2023 (which ended on September 30, 2023). Revenue for the calendar year 2023 (January to December) has been calculated by Statista based on the quarterly figures provided by the company.
² Data for Merlin Entertainments was converted from British Pounds using the conversion rate: 1 GBP = 0.785067 U.S. dollars (as of December 30, 2023, when the company's fiscal year ended).
Figures were compiled by Statista from company data.
Profit from the additional features of your individual account
Currently, you are using a shared account. To use individual functions (e.g., mark statistics as favourites, set
statistic alerts) please log in with your personal account.
If you are an admin, please authenticate by logging in again.
Learn more about how Statista can support your business.
Statista. (July 1, 2024). Leading selected amusement and theme park companies worldwide in 2023, by revenue (in billion U.S. dollars) [Graph]. In Statista. Retrieved November 09, 2024, from https://www.statista.com/statistics/258810/theme-und-amusement-park-companies-ranked-by-revenue/
Statista. "Leading selected amusement and theme park companies worldwide in 2023, by revenue (in billion U.S. dollars)." Chart. July 1, 2024. Statista. Accessed November 09, 2024. https://www.statista.com/statistics/258810/theme-und-amusement-park-companies-ranked-by-revenue/
Statista. (2024). Leading selected amusement and theme park companies worldwide in 2023, by revenue (in billion U.S. dollars). Statista. Statista Inc.. Accessed: November 09, 2024. https://www.statista.com/statistics/258810/theme-und-amusement-park-companies-ranked-by-revenue/
Statista. "Leading Selected Amusement and Theme Park Companies Worldwide in 2023, by Revenue (in Billion U.S. Dollars)." Statista, Statista Inc., 1 Jul 2024, https://www.statista.com/statistics/258810/theme-und-amusement-park-companies-ranked-by-revenue/
Statista, Leading selected amusement and theme park companies worldwide in 2023, by revenue (in billion U.S. dollars) Statista, https://www.statista.com/statistics/258810/theme-und-amusement-park-companies-ranked-by-revenue/ (last visited November 09, 2024)
Leading selected amusement and theme park companies worldwide in 2023, by revenue (in billion U.S. dollars) [Graph], Statista, July 1, 2024. [Online]. Available: https://www.statista.com/statistics/258810/theme-und-amusement-park-companies-ranked-by-revenue/