iOS and Android, Apple's and Google's respective operating systems, were the mobile OS market leaders in the United States in recent years, making up almost 100 percent of the market. The market share of both iOS and Android has remained relatively constant over the past 12 months at or around 57 percent and 43 percent, respectively.
Market share of mobile operating systems in the United States from January 2012 to August 2023
Basic Account
Get to know the platform
You only have access to basic statistics.
This statistic is not included in your account.
Starter Account
The ideal entry-level account for individual users
- Instant access to 1m statistics
- Download in XLS, PDF & PNG format
- Detailed references
$149 USD / Month *
Professional Account
Full access
Business Solutions including all features.
* Prices do not include sales tax.
Other statistics that may interest you Android
Overview
3
Mobile
5
- Premium Statistic Global smartphone shipments by vendor 2009-2023
- Premium Statistic Quarterly smartphone market share worldwide by vendor 2009-2023
- Premium Statistic Market share of mobile operating systems worldwide 2009-2023
- Premium Statistic Mobile Android version market share worldwide 2018-2023
- Premium Statistic Average selling price of Android smartphones worldwide 2017 to 2023
Tablets
6
- Premium Statistic Tablet vendor shipments worldwide 2012-2023, by quarter
- Premium Statistic Global market share held by tablet vendors 2011-2023
- Basic Statistic Global tablet shipments by operating system per quarter 2010-2022
- Premium Statistic Tablet OS market share worldwide 2016-2023, by quarter
- Premium Statistic Tablet Android version market share worldwide 2018-2023
- Premium Statistic Global market share held by computer operating systems 2012-2023, by month
Android apps
5
- Basic Statistic Google Play: number of available apps 2009-2023
- Premium Statistic Leading Android apps worldwide 2023, by downloads
- Premium Statistic Global Android app retention rate Q3 2022
- Basic Statistic Distribution of free and paid Android apps 2019-2023
- Premium Statistic Star ratings for Android apps 2022, by app category
Regional consumption
8
- Premium Statistic 
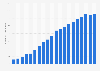
Share of mobile operating systems in the United States 2012-2023, by month
- Premium Statistic Mobile Android version market share in the United States 2017-2023
- Premium Statistic Mobile operating systems: market share in Europe 2010-2022
- Premium Statistic Market share of mobile operating systems in Germany 2010-2022
- Premium Statistic Mobile OS market share in the United Kingdom (UK) 2011-2023
- Premium Statistic Mobile Android OS version market share in the United Kingdom 2017-2022
- Premium Statistic Market share of mobile operating systems in Spain 2010-2022
- Premium Statistic Market share of mobile operating systems in Italy 2010-2022
Further related statistics
18
- Market share held by smartphone OS in Mexico 2013-2018, by month
- Global smartphone sales by operating system 2009-2018, by quarter
- Global market share held by smartphone operating systems 2009-2018, by quarter
- Leading mobile operating systems ranked by market share in Italy 2010-2022
- Mobile Apple iOS market share worldwide 2018-2023, by version
- Colombia: mobile OS market share 2017-2023
- Smartphone operating system preference in the U.S. 2017
- Share of Android 8.0 Oreo in mobile and tablet OS market India 2020-2021
- Share of Android 8.1 Oreo in mobile and tablet OS market India 2021-2022
- Monthly market share of mobile operating systems Bangladesh 2021-2023
- Market share of mobile operating systems Qatar 2015-2020
- Share of Android 6.0 Marshmallow in mobile and tablet OS market India 2021-2022
- Share of Android 5.1 Lollipop in mobile and tablet OS market India 2021-2022
- Share of global smartphone installed base by operating system 2013-2017
- Brazil: share of jobs in the app industry 2017, by operating system
- App devlopers' inclination to use own OS developed by Huawei in China 2019
- Thailand - types of smatrphone operating systems used for personal purposes 2016-2018
- Reasons of Chinese netizens not wanting to use OS developed by Huawei in China 2019
Further Content: You might find this interesting as well
Statistics
- Market share held by smartphone OS in Mexico 2013-2018, by month
- Global smartphone sales by operating system 2009-2018, by quarter
- Global market share held by smartphone operating systems 2009-2018, by quarter
- Leading mobile operating systems ranked by market share in Italy 2010-2022
- Mobile Apple iOS market share worldwide 2018-2023, by version
- Colombia: mobile OS market share 2017-2023
- Smartphone operating system preference in the U.S. 2017
- Share of Android 8.0 Oreo in mobile and tablet OS market India 2020-2021
- Share of Android 8.1 Oreo in mobile and tablet OS market India 2021-2022
- Monthly market share of mobile operating systems Bangladesh 2021-2023
- Market share of mobile operating systems Qatar 2015-2020
- Share of Android 6.0 Marshmallow in mobile and tablet OS market India 2021-2022
- Share of Android 5.1 Lollipop in mobile and tablet OS market India 2021-2022
- Share of global smartphone installed base by operating system 2013-2017
- Brazil: share of jobs in the app industry 2017, by operating system
- App devlopers' inclination to use own OS developed by Huawei in China 2019
- Thailand - types of smatrphone operating systems used for personal purposes 2016-2018
- Reasons of Chinese netizens not wanting to use OS developed by Huawei in China 2019
StatCounter. (September 4, 2023). Market share of mobile operating systems in the United States from January 2012 to August 2023 [Graph]. In Statista. Retrieved December 08, 2023, from https://www.statista.com/statistics/272700/market-share-held-by-mobile-operating-systems-in-the-us-since-2009/
StatCounter. "Market share of mobile operating systems in the United States from January 2012 to August 2023." Chart. September 4, 2023. Statista. Accessed December 08, 2023. https://www.statista.com/statistics/272700/market-share-held-by-mobile-operating-systems-in-the-us-since-2009/
StatCounter. (2023). Market share of mobile operating systems in the United States from January 2012 to August 2023. Statista. Statista Inc.. Accessed: December 08, 2023. https://www.statista.com/statistics/272700/market-share-held-by-mobile-operating-systems-in-the-us-since-2009/
StatCounter. "Market Share of Mobile Operating Systems in The United States from January 2012 to August 2023." Statista, Statista Inc., 4 Sep 2023, https://www.statista.com/statistics/272700/market-share-held-by-mobile-operating-systems-in-the-us-since-2009/
StatCounter, Market share of mobile operating systems in the United States from January 2012 to August 2023 Statista, https://www.statista.com/statistics/272700/market-share-held-by-mobile-operating-systems-in-the-us-since-2009/ (last visited December 08, 2023)
Market share of mobile operating systems in the United States from January 2012 to August 2023 [Graph], StatCounter, September 4, 2023. [Online]. Available: https://www.statista.com/statistics/272700/market-share-held-by-mobile-operating-systems-in-the-us-since-2009/