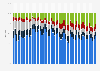
Microsoft's Windows was the leading computer operating system in the United States as of July 2024, with a market share of roughly 60 percent. Apple's MacOS commanded a market share of about 23.3 percent, a marginal increase from the previous year.
Market share held by the leading computer operating systems in the United States from January 2012 to July 2024
Profit from the additional features of your individual account
Currently, you are using a shared account. To use individual functions (e.g., mark statistics as favourites, set
statistic alerts) please log in with your personal account.
If you are an admin, please authenticate by logging in again.
Learn more about how Statista can support your business.
StatCounter. (August 8, 2024). Market share held by the leading computer operating systems in the United States from January 2012 to July 2024 [Graph]. In Statista. Retrieved September 19, 2024, from https://www.statista.com/statistics/272667/market-share-held-by-operating-systems-in-the-us-since-2009/
StatCounter. "Market share held by the leading computer operating systems in the United States from January 2012 to July 2024." Chart. August 8, 2024. Statista. Accessed September 19, 2024. https://www.statista.com/statistics/272667/market-share-held-by-operating-systems-in-the-us-since-2009/
StatCounter. (2024). Market share held by the leading computer operating systems in the United States from January 2012 to July 2024. Statista. Statista Inc.. Accessed: September 19, 2024. https://www.statista.com/statistics/272667/market-share-held-by-operating-systems-in-the-us-since-2009/
StatCounter. "Market Share Held by The Leading Computer Operating Systems in The United States from January 2012 to July 2024." Statista, Statista Inc., 8 Aug 2024, https://www.statista.com/statistics/272667/market-share-held-by-operating-systems-in-the-us-since-2009/
StatCounter, Market share held by the leading computer operating systems in the United States from January 2012 to July 2024 Statista, https://www.statista.com/statistics/272667/market-share-held-by-operating-systems-in-the-us-since-2009/ (last visited September 19, 2024)
Market share held by the leading computer operating systems in the United States from January 2012 to July 2024 [Graph], StatCounter, August 8, 2024. [Online]. Available: https://www.statista.com/statistics/272667/market-share-held-by-operating-systems-in-the-us-since-2009/