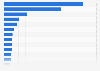
This survey shows the share of individuals who checked price comparison websites in Denmark in 2016, by gender and frequency. That year, 60 percent of men and 47 percent of women were checking price comparison websites every time.
Share of individuals who checked price comparison websites in Denmark in 2016, by gender and frequency
Loading statistic...
Basic Account
Get to know the platform
You only have access to basic statistics.
Starter Account
The ideal entry-level account for individual users
- Instant access to 1m statistics
- Download in XLS, PDF & PNG format
- Detailed references
$229 USD $199 USD / Month *
in the first 12 months
Professional Account
Full access
Business Solutions including all features.
* Prices do not include sales tax.
Other statistics that may interest you Statistics on
About the industry
9
- Basic Statistic Social media users who restricted access to their profiles in Denmark 2016, by gender
- Basic Statistic Internet users who booked doctor appointments online in Denmark 2018, by gender
- Premium Statistic Forecast of the mobile broadband connections in Denmark 2019-2028
- Premium Statistic Forecast of the mobile broadband connections in Sweden 2019-2028
- Premium Statistic Mobile internet usage reach in France 2019-2028
- Premium Statistic Lawfulness of watching TV series online in France 2022
- Premium Statistic Daily TikTok access frequency in Poland 2022
- Premium Statistic Frequency of posting video content on TikTok in Poland 2022
- Premium Statistic Number of cable modem internet subscribers in Russia 2012-2021
About the region
10
- Basic Statistic Share of online shoppers in Denmark 2019, by gender
- Basic Statistic Share of IoT users in Denmark 2020, by age
- Basic Statistic Share of smart home IoT users in Denmark 2020, by education level
- Basic Statistic Share of social media users in Denmark 2017-2020, by age group
- Premium Statistic Internet access at home in Denmark 2016-2019, by age
- Basic Statistic Share of Smart Home users in Europe 2019
- Premium Statistic Social media usage among children in Denmark 2018, by age and gender
- Premium Statistic Share of children being bullied on social media in Denmark 2018, by age and gender
- Premium Statistic Social media addiction among children in Denmark 2018, by age and gender
- Premium Statistic Share of children bullying on social media in Denmark 2018, by age and gender
Selected statistics
5
- Basic Statistic Number of internet users in Great Britain 2006-2020, by frequency
- Basic Statistic E-mail messaging penetration in Great Britain 2007-2020
- Basic Statistic Hours of internet use per week in the United Kingdom (UK) 2005-2019, by location
- Premium Statistic Device preference for internet browsing in the United Kingdom (UK) 2015, by age
- Basic Statistic Concerns about connected devices use in the United Kingdom (UK) 2013-2014
Other regions
10
- Basic Statistic Digital media purchasing penetration in Great Britain 2020, by gender
- Basic Statistic Global consumers willingness to pay monthly fee for personal data protection 2018
- Premium Statistic Leisure time spent by young French people online by device and by gender 2018
- Premium Statistic Internet usage frequency in Germany in 2019, by activity
- Premium Statistic Bulgaria: daily internet usage 2017, by age group
- Premium Statistic Selected websites average time spent using per person in Australia December 2019
- Premium Statistic Activities of internet café visitors in China 2019
- Premium Statistic Latin America: e-commerce websites accessed by children 2017-2020
- Premium Statistic LinkedIn users in Sweden 2019, by age group
- Basic Statistic Frequency of online access in Canada 2019
Related statistics
10
- Basic Statistic Global age distribution of internet users 2022, by country income level
- Basic Statistic Common online activities in Norway 2022
- Basic Statistic Leading online activities ever carried out in the United Kingdom (UK) 2021
- Premium Statistic Internet users aged 16-29 years in Ireland 2009-2022
- Premium Statistic Internet users aged 45-59 years in Ireland 2009-2021
- Premium Statistic Internet users aged 60-74 years in Ireland 2009-2021
- Premium Statistic Internet users in Ireland from 2009-2022, by frequency of use
- Basic Statistic U.S. adults who are online almost constantly 2021, by gender
- Basic Statistic U.S. adults who are online almost constantly 2021, by ethnicity
- Basic Statistic U.S. adults who are online almost constantly 2021, by age
Further related statistics
10
- Households with internet access in GB from 2014 to 2020, by household composition
- Mobile internet use via laptops in Great Britain 2019, by demographic
- Social network profile creation in the UK 2010-2020, by socio-economic group
- Consumer electronics: Online purchasing in Great Britain 2020, by demographic
- Internet usage on a mobile phone in Great Britain 2010-2019, by age
- Daily internet use penetration in Great Britain 2006-2020
- User numbers of microblogs in China 2010-2018
- Revenue of Sohu in China 2022, by segment
- Baidu's total revenue 2012-2022
- UK console gaming reach 2015-2022, by gender
Further Content: You might find this interesting as well
Statistics
- Households with internet access in GB from 2014 to 2020, by household composition
- Mobile internet use via laptops in Great Britain 2019, by demographic
- Social network profile creation in the UK 2010-2020, by socio-economic group
- Consumer electronics: Online purchasing in Great Britain 2020, by demographic
- Internet usage on a mobile phone in Great Britain 2010-2019, by age
- Daily internet use penetration in Great Britain 2006-2020
- User numbers of microblogs in China 2010-2018
- Revenue of Sohu in China 2022, by segment
- Baidu's total revenue 2012-2022
- UK console gaming reach 2015-2022, by gender
Statistics Denmark. (November 28, 2016). Share of individuals who checked price comparison websites in Denmark in 2016, by gender and frequency [Graph]. In Statista. Retrieved October 01, 2023, from https://www.statista.com/statistics/649611/individuals-who-have-checked-price-comparison-websites-in-denmark-by-gender-and-frequency/
Statistics Denmark. "Share of individuals who checked price comparison websites in Denmark in 2016, by gender and frequency." Chart. November 28, 2016. Statista. Accessed October 01, 2023. https://www.statista.com/statistics/649611/individuals-who-have-checked-price-comparison-websites-in-denmark-by-gender-and-frequency/
Statistics Denmark. (2016). Share of individuals who checked price comparison websites in Denmark in 2016, by gender and frequency. Statista. Statista Inc.. Accessed: October 01, 2023. https://www.statista.com/statistics/649611/individuals-who-have-checked-price-comparison-websites-in-denmark-by-gender-and-frequency/
Statistics Denmark. "Share of Individuals Who Checked Price Comparison Websites in Denmark in 2016, by Gender and Frequency." Statista, Statista Inc., 28 Nov 2016, https://www.statista.com/statistics/649611/individuals-who-have-checked-price-comparison-websites-in-denmark-by-gender-and-frequency/
Statistics Denmark, Share of individuals who checked price comparison websites in Denmark in 2016, by gender and frequency Statista, https://www.statista.com/statistics/649611/individuals-who-have-checked-price-comparison-websites-in-denmark-by-gender-and-frequency/ (last visited October 01, 2023)
Share of individuals who checked price comparison websites in Denmark in 2016, by gender and frequency [Graph], Statistics Denmark, November 28, 2016. [Online]. Available: https://www.statista.com/statistics/649611/individuals-who-have-checked-price-comparison-websites-in-denmark-by-gender-and-frequency/