Skip to main content
Consumer Goods & FMCG
E-Commerce
Economy & Politics
Energy & Environment
Health, Pharma & Medtech
Internet
Media
Technology & Telecommunications
Transportation & Logistics
Travel, Tourism & Hospitality
View all industries
Global data volume growth
Global AI market size
Number of generative AI users worldwide
Global inflation rate
Retail e-commerce sales worldwide
Largest economies worldwide
Biggest social media platforms by users
Global EV market share by manufacturer
International tourist arrivals by world region
Global annual CO₂ emissions
Browse recent statistics
Artificial intelligence (AI) worldwide
TikTok
Nvidia
E-commerce worldwide
Global GDP
Instagram
Apparel market worldwide
Video gaming worldwide
Global renewable energy industry
Influencer marketing worldwide
Browse recent topics
Consumer Trends 2026
Artificial Intelligence: in-depth market analysis
E-commerce challenges
Global economy
TikTok
Luxury goods: in-depth market analysis
Electric vehicles: A global overview
Video gaming worldwide
Travel and tourism trends 2026
Battery recycling worldwide
Browse recent reports
Explore the tool
Explore Classic mode
Advertising & Media
eCommerce
Consumer
Finance
Global Indicators
Health
Industrial
Mobility
Technology
Explore Market Insights
eCommerce Insights
Research AI
Book a demo
All integrations
Developer docs
Explore Statista Connect
Research
Strategy & Consulting
Marketing
Media & PR
Explore AI assistants
Marketing
Research & Development
Strategy
Sales
Find the fact
Tell the story
Win the pitch
Understand the market
Develop your strategy
Academia
Agencies
Consultancies
Consumer goods
Finance
Tech
Research solutions
Strategy consulting
Communication services
Explore Statista+
Statista R
Statista Healthcare
About Statista
First steps & help center
Webinar & training hub
Success stories
Individuals & Small Teams
Businesses & Enterprises
Academia & Government
English
Deutsch
Daily Data
Global stories vividly visualized
Food Poverty
May 12, 2023
This chart shows the number of emergency food parcels given to people by Trussell Trust in the UK from 2017 to 2023.
More Information
Labor force participation
May 12, 2023
This chart shows the global labor force participation rate of people aged 25-54 in 2022, by sex and presence of children under 6.
More Information
Mother's Day
May 12, 2023
This chart shows planned Mother's Day spending in the United States since 2010.
More Information
Sponsored post by Booking.com
May 11, 2023
This graphics shows that Australian hoteliers value international exposure from digital platforms.
More Information
AI
May 11, 2023
This chart shows how often the term "AI" was mentioned during the latest earnings calls of big tech companies.
More Information
EVs
May 11, 2023
This chart shows electric vehicle sales by model and location in 2022 as well as the number of available electric car models by region...
More Information
Turkey presidential election
May 11, 2023
This chart shows the number of Turkish people living in different European countries.
More Information
Food Poverty
May 11, 2023
This chart shows the number of three-day emergency food supplies given per 100,000 population in 2022/23.
More Information
Sponsored post by Booking.com
May 11, 2023
This graphic shows that a majority of travelers want to do more for sustainability.
More Information
Inflation
May 10, 2023
This chart shows the inflation rates of countries in Latin America as of September 2022.
More Information
Global Affairs
May 10, 2023
This chart shows the countries in which internet services have been deliberately disrupted by the government at least once.
More Information
Scheduled Tribes
May 10, 2023
This chart shows scheduled tribes as a share of total population, by Indian state or territory (in percent).
More Information
Scheduled Tribes
May 10, 2023
This chart shows the share of Manipur state population by selected socio-economic markers (in percent).
More Information
Get the App
May 10, 2023
Daily Data by Statista - download the app now!
More Information
Sponsored post by Booking.com
May 10, 2023
This graphic shows that international visitor spending in the U.S. is experiencing a recovery curve.
More Information
Russia-Ukraine
May 9, 2023
This chart shows countries' stance on the Russia-Ukraine war by share of global GDP and population.
More Information
Russia-Ukraine War
May 9, 2023
This chart shows where different countries stand in terms of Russia, as of March 2023.
More Information
Super Mario
May 9, 2023
This chart shows the best-selling Super Mario video games of all time.
More Information
Gambling
May 9, 2023
This chart shows the estimated users and penetration rate of online sports betting from 2017 to 2027 in Canada and the UK.
More Information
Habitat Loss
May 8, 2023
This chart shows the change in the total area suitable as elephant habitat in Asian countries between 1700 and 2015.
More Information
Debt Ceiling
May 8, 2023
This chart shows the public opinion on whether or not Congress should raise the debt ceiling.
More Information
Debt Ceiling
May 8, 2023
This chart shows the debt ceiling in the United States from 1981 to 2023 (in trillion U.S. dollars).
More Information
Migration
May 8, 2023
This chart shows how many non-EU citizens have been granted temporary protection, as of the end of March 2023.
More Information
Armed Conflict
May 8, 2023
This chart shows countries with reported armed clashes between state forces and/or rebels in 2023.
More Information
U.S. Debt Crisis
May 8, 2023
This chart shows the estimated economic effects of different debt ceiling outcomes in the U.S. in Q3 2023.
More Information
Smartphones
May 5, 2023
This chart shows Apple's estimated share of global smartphone shipments, revenue and operating profits in Q1 2023.
More Information
Cannabis and CBD
May 5, 2023
This chart shows the estimated number of cannabis and CBD product users worldwide as well as the estimated revenue per user in 2023...
More Information
Royal Reign
May 5, 2023
This chart shows countries where a monarch is head of state.
More Information
Digital Media
May 5, 2023
This chart shows the most popular providers of paid digital media in the U.S.
More Information
Apple
May 5, 2023
This chart shows Apple's services revenue compared to total revenue of selected Fortune 500 companies in the first three months of...
More Information
Coronation
May 5, 2023
This chart shows opinions of UK adults on whether the country should have a monarchy in the future, by age group.
More Information
coronation
May 5, 2023
This chart shows the relative costs of the UK's past coronations, adjusted for inflation.
More Information
Satellites
May 4, 2023
This chart shows the countries with the most satellites in space as well as their most common uses.
More Information
Traffic Deaths
May 4, 2023
This chart shows average annual pedestrian deaths per 100,000 people in U.S. states and the most affected metro areas (2016-2020).
More Information
Star Wars
May 4, 2023
The chart shows worldwide box office revenue of the highest-grossing Star Wars movies, adjusted for ticket price inflation.
More Information
Same-Sex Marriage
May 3, 2023
This chart shows the share of respondents in selected countries who said that same-sex couples should have the right to marry or form...
More Information
Pharma
May 3, 2023
This chart shows the revenue of Pfizer in Q1 2022 and Q1 2023.
More Information
Coronavirus Vaccinations
May 3, 2023
This chart shows daily new Covid-19 vaccine doses given out globally as initial protocol immunizations and booster shots.
More Information
Sponsored post by Booking.com
May 3, 2023
This graphic shows that most travelers consider sustainability certifications when planning their next trip.
More Information
Press freedom worldwide
May 3, 2023
This chart shows the countries ranking highest and lowest on the Press Freedom Index in 2022.
More Information
climate change
May 3, 2023
This chart shows the share of U.S. respondents that say that the government will hit the country's net zero goals.
More Information
Sponsored post by Booking.com
May 3, 2023
This graphic shows the benefits of sustainability program certification for accommodation providers.
More Information
Air Travel
May 2, 2023
This chart shows the change in planned air passenger seat capacity between week of April 24, 2023, and same week in 2019 (in percent).
More Information
Sponsored post by Booking.com
May 2, 2023
This graphic shows the barriers to sustainable travel.
More Information
Sponsored post by Booking.com
May 2, 2023
This graphic shows what travelers are prepared to do to travel more sustainably.
More Information
Politics
May 2, 2023
This chart shows government figures for protesters at demonstrations against pension reforms in France from 1995 to 2023.
More Information
U.S. Banking Crisis
May 2, 2023
This chart shows the largest U.S. banks in terms of domestic deposits at the end of 2022.
More Information
U.S. Banking Crisis
May 2, 2023
This chart shows the number of FDIC-insured commercial banks and their total branches in the United States.
More Information
U.S. National Debt
May 2, 2023
This chart shows the gross federal public debt in the United States (in trillion U.S. dollars).
More Information
Fossil fuels
May 2, 2023
This chart shows the biggest producers of oil and gas in Europe in 2021.
More Information
Income Classes
Apr 28, 2023
This chart shows the share of people and aggregate income associated with U.S. income classes in 1970/71 and 2021 (in percent).
More Information
Uber
Apr 28, 2023
This chart shows the share of people that use Uber in different countries.
More Information
Air Travel
Apr 28, 2023
This chart shows the number of scheduled seats on the world's busiest air routes in April 2023.
More Information
Payment Methods
Apr 28, 2023
Share of respondents in selected countries who used the following methods of payment in the last 12 months (2023).
More Information
Aviation
Apr 27, 2023
This chart shows the quarterly net profit/loss of The Boeing Company.
More Information
Social Media Marketing
Apr 27, 2023
This chart shows which content formats social media marketers plan to invest most in in 2023.
More Information
Meta Platforms
Apr 27, 2023
This chart shows the year-over-year revenue growth of Meta/Facebook since 2012.
More Information
Stand Your Ground/Shoot First
Apr 27, 2023
This chart shows U.S. states with shoot first/stand your ground laws or comparable court decisions (as of April 2023).
More Information
Toys
Apr 26, 2023
This chart shows the countries with highest estimated revenue in the dolls & stuffed toys segment.
More Information
Tech
Apr 26, 2023
This chart shows Q3 revenue and operating income of Microsoft in the segment 'Intelligent Cloud' since FY 2018.
More Information
Defense
Apr 26, 2023
This chart shows the personnel and budget of the U.S. Space Force in 2021 and 2023.
More Information
Banking Crisis
Apr 25, 2023
This chart shows net new assets/net asset outflows reported by Credit Suisse.
More Information
Banking Crisis
Apr 25, 2023
This chart shows the weekly change in deposits at small domestically chartered commercial banks in the U.S.
More Information
Garments industry
Apr 25, 2023
This chart shows the world's biggest exporters of clothes.
More Information
Digital Music
Apr 25, 2023
This chart shows the share of respondents spending or not spending money on digital music.
More Information
Defense Spending
Apr 24, 2023
This chart shows the change in military expenditure between 2013-17 and 2018-2022, by country.
More Information
Earth Day
Apr 21, 2023
This chart shows which countries are most prepared for the green tech transition in terms of frontier technologies adoption.
More Information
Earth Day
Apr 21, 2023
This chart shows the total exports of green technologies from developed/developing nations.
More Information
Role Models?
Apr 21, 2023
This chart shows the share of U.S. respondents who agreed with the following statements on national politicians/actors.
More Information
Sponsored post by Booking.com
Apr 20, 2023
This infographic shows the online travel platform features regarded as most important by independent South Korean accommodation providers.
More Information
Home Video
Apr 20, 2023
This chart shows estimated global home video revenue, by segment.
More Information
Sponsored post by Booking.com
Apr 20, 2023
This infographic shows the online travel platform features regarded as most important by independent Japanese accommodation providers.
More Information
Biggest Economies
Apr 20, 2023
This chart shows the biggest economies in the world in 1992, 2010 and 2028 (projection).
More Information
Society
Apr 20, 2023
This chart shows the share of U.S. adults that say they have tried marijuana from 1969 to 2022.
More Information
Incarceration
Apr 19, 2023
This chart shows U.S. incarceration rates by sex and race/ethnic origin.
More Information
Apple
Apr 19, 2023
This chart shows the share of urban Indians who used the following Apple products and services (in percent).
More Information
Apple
Apr 19, 2023
This chart shows countries with Apple stores (as of April 2023).
More Information
Environment
Apr 19, 2023
This chart shows the share of countries' carbon footprint related to the import of goods and services, by origin.
More Information
Critical Race Theory
Apr 19, 2023
This chart shows anti-Critical Race Theory measures adopted in the U.S. (as of April 2023).
More Information
Sudan
Apr 18, 2023
This chart shows the number of IDPs in Sudan in 2022.
More Information
Ukrainian Grain Exports
Apr 18, 2023
This chart shows the value of Ukrainian cereal exports to its neighboring countries.
More Information
Drugs
Apr 18, 2023
This chart shows global illicit cultivation of coca bush from 2011-2021 (hectares).
More Information
Africa
Apr 18, 2023
This chart shows coups/coup attempts/coup plots in Sudan since 1956.
More Information
Wealth
Apr 18, 2023
This chart compares countries according to the World Happiness Index 2023 and GDP per capita.
More Information
Entrepreneurialism
Apr 17, 2023
This chart shows the assessment of business opportunity and willingness to start a business in selected countries in 2022.
More Information
Sponsored post by Booking.com
Apr 17, 2023
This graphic shows the annual emission reduction potential in the travel accommodations sector.
More Information
TED2023
Apr 17, 2023
This chart shows the demographics of TED talks viewership using averages from Jan-Mar, 2023.
More Information
TED Conference
Apr 17, 2023
This chart shows the most popular TED talks of all time.
More Information
World Leaders
Apr 14, 2023
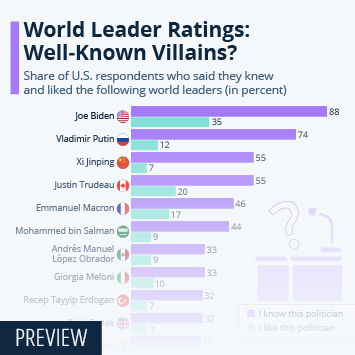
This chart shows the share of U.S. respondents who said they knew and liked the following world leaders (in percent).
More Information
U.S. politics
Apr 14, 2023
This chart shows the share of U.S. adults that think the following politicians are doing a good job.
More Information
43
/
161
Contact
Get in touch with us. We are happy to help.
Do you still have questions?
Feel free to contact us anytime using our
contact form
or visit our
FAQ page
.
Your contact to the Infographics Newsroom
Felix Richter
Data Journalist
felix.richter@statista.com
+49 (40) 284 841 557