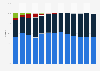
During the second quarter of 2021, mobile gaming apps generated almost 889 million U.S. dollars in consumer spending from users in Australia, up by 12.47 percent from the corresponding quarter of the previous year. Between the beginning of 2020 and the first half of 2021, mobile apps in the finance vertical reported a constant growth trend. Apps in the lifestyle category, which includes mobile dating services, reported an increase of 45 percent in consumer spending in the examined period, reaching 24.4 million U.S. dollars in spending from users in Australia during the last measured quarter.
Consumer spending on mobile apps in Australia from 1st quarter 2020 to 2nd quarter 2021, by category
(in million U.S. dollars)
Profit from the additional features of your individual account
Currently, you are using a shared account. To use individual functions (e.g., mark statistics as favourites, set
statistic alerts) please log in with your personal account.
If you are an admin, please authenticate by logging in again.
Learn more about how Statista can support your business.
Data.ai. (December 24, 2021). Consumer spending on mobile apps in Australia from 1st quarter 2020 to 2nd quarter 2021, by category (in million U.S. dollars) [Graph]. In Statista. Retrieved September 20, 2024, from https://www.statista.com/statistics/1282452/australia-quarterly-app-consumer-spend-by-category/
Data.ai. "Consumer spending on mobile apps in Australia from 1st quarter 2020 to 2nd quarter 2021, by category (in million U.S. dollars)." Chart. December 24, 2021. Statista. Accessed September 20, 2024. https://www.statista.com/statistics/1282452/australia-quarterly-app-consumer-spend-by-category/
Data.ai. (2021). Consumer spending on mobile apps in Australia from 1st quarter 2020 to 2nd quarter 2021, by category (in million U.S. dollars). Statista. Statista Inc.. Accessed: September 20, 2024. https://www.statista.com/statistics/1282452/australia-quarterly-app-consumer-spend-by-category/
Data.ai. "Consumer Spending on Mobile Apps in Australia from 1st Quarter 2020 to 2nd Quarter 2021, by Category (in Million U.S. Dollars)." Statista, Statista Inc., 24 Dec 2021, https://www.statista.com/statistics/1282452/australia-quarterly-app-consumer-spend-by-category/
Data.ai, Consumer spending on mobile apps in Australia from 1st quarter 2020 to 2nd quarter 2021, by category (in million U.S. dollars) Statista, https://www.statista.com/statistics/1282452/australia-quarterly-app-consumer-spend-by-category/ (last visited September 20, 2024)
Consumer spending on mobile apps in Australia from 1st quarter 2020 to 2nd quarter 2021, by category (in million U.S. dollars) [Graph], Data.ai, December 24, 2021. [Online]. Available: https://www.statista.com/statistics/1282452/australia-quarterly-app-consumer-spend-by-category/