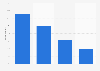
An October 2022 survey found that among U.S. smartphone users below the age of 55, the most common activities on smartphones are watching videos, playing games and using social networks. For older respondents, getting weather information, using social networks and news were the most common activities.
Leading smartphone activities done at least once per week among users in the United States as of October 2022, by age group
Basic Account
Get to know the platform
You only have access to basic statistics.
This statistic is not included in your account.
Starter Account
The ideal entry-level account for individual users
- Instant access to 1m statistics
- Download in XLS, PDF & PNG format
- Detailed references
$59 USD $39 USD / Month *
in the first 12 months
Professional Account
Full access
Business Solutions including all features.
* Prices do not include sales tax.
Statistics on U.S. internet user demographics - age groups
Internet usage overview
8
- Basic Statistic United States internet penetration 2000-2023
- Basic Statistic Internet usage penetration in the U.S. 2022, by age group and device
- Basic Statistic U.S. internet usage penetration 2021, by age group
- Basic Statistic U.S. adult internet usage reach 2000-2021, by age group
- Basic Statistic U.S. home broadband usage reach 2000-2021, by age group
- Premium Statistic U.S. internet access Q3 2022, by device
- Premium Statistic Connected devices ownership in the U.S. 2022, by age
- Basic Statistic U.S. adults who are online almost constantly 2021, by age
Mobile device and app usage
7
- Premium Statistic Share of smartphone owners in the U.S. 2022, by age
- Premium Statistic Share of U.S. children owning a smartphone 2015-2021, by age
- Premium Statistic Time spent using smartphone per week in U.S 2022, by age
- Premium Statistic Leading weekly smartphone activities by U.S. users 2022, by age
- Premium Statistic U.S. app user engagement 2021, by age group
- Premium Statistic U.S. apps active user reach 2021, by age group
- Premium Statistic U.S. smartphone gamers by age 2022
Online activities
8
- Basic Statistic Internet activities of U.S. users 2021
- Premium Statistic Digital video watching frequency among U.S. adults 2022, by age group
- Premium Statistic U.S. device usage for weekly online video viewing 2022, by age group
- Premium Statistic Frequency of watching live stream video in the U.S. 2022, by age group
- Premium Statistic U.S. users who livestream their own content 2022, by age
- Premium Statistic U.S. users creating videos for the internet 2022, by age group
- Premium Statistic Most common U.S. users activities via email in 2022, by age group
- Basic Statistic Leading weekly smartphone activities by U.S. Millennials 2022
Social media usage
8
- Basic Statistic Social media users in the United States 2019-2028
- Premium Statistic U.S. consumers use of social media services in the past week 2022, by age group
- Basic Statistic U.S. Facebook users 2022, by age group
- Premium Statistic U.S. Instagram users 2022, by age group
- Basic Statistic U.S. registered YouTube user reach 2022, by age group
- Basic Statistic Twitter: usage reach in the United States 2021, by age group
- Basic Statistic TikTok user ratio in the U.S. 2022, by age group
- Premium Statistic BeReal usage and attitude in the U.S. 2022, by age group
Online user experiences
7
- Premium Statistic Attitudes towards the internet in the U.S. 2022
- Premium Statistic Frequency of digital detoxing in the U.S. 2022, by age
- Basic Statistic U.S. adults believing the internet should be a free speech zone 2022, by age group
- Premium Statistic U.S. views on free speech online and welcoming online environments 2022, by age group
- Basic Statistic U.S. user opinions on the social media content moderation policies 2022, by age
- Basic Statistic U.S. social media users on Facebook protecting their data 2022. by generation
- Basic Statistic Social platforms leading to empathy fatigue in the U.S. 2022, by generation
E-commerce
8
- Basic Statistic Retail e-commerce revenue in the U.S. 2017-2027
- Basic Statistic Main channels to buy products for consumers the U.S. 2022, by generation
- Premium Statistic E-commerce shoppers mobile audience share in the U.S. 2022, by age
- Premium Statistic Main online purchase influence factors in the U.S. & UK 2022, by generation
- Premium Statistic U.S. buyer preference for product discovery via social media 2021, by generation
- Premium Statistic Favorite platforms for online shopping videos in the U.S. 2022, by generation
- Premium Statistic Types of accounts shoppers follow and buy from in the U.S. 2022, by age
- Premium Statistic Share of online grocery buyers in the U.S. 2022, by generational cohort
Further related statistics
21
- Penetration of selected consumer electronics in households in Germany 2021
- Reach of most popular U.S. smartphone apps 2023
- Forecast of smartphone user numbers in Belgium 2018-2025
- Mexico: smartphone internet traffic 2018-2023, by OS
- Number of smartphone users Japan 2018-2027
- Smartphone penetration rate Japan 2018-2027
- Most popular smartphone activities for global users 2022
- Number of 5G-enabled smartphone shipments in Latin America 2020-2023
- Smartphone activities in selected countries 2022
- Germany: smartphone activities 2021-2022
- Germany: smartphone activities 2021-2022. by age
- Germany: smartphone activities 2021-2022. by gender
- Leading types of goods smartphone gamers spent money on in past month Japan 2022
- Forecast of smartphone user numbers in Finland 2018-2027
- Most popular smartphone apps South Korea 2021, by type
- Frequency of playing mobiles games via smartphone Japan 2022, by age group
- Frequency of playing mobiles games via smartphone Japan 2022
- Share of users who spent money on smartphone games in past month Japan 2022
- Share of users who spent money on smartphone games in past month Japan 2022, by age
- Brazil: apps in which smartphone users spent the most time 2022
- Smartphone ownership in Sweden 2021, by type
Further Content: You might find this interesting as well
Vorhaus Advisors. (November 30, 2022). Leading smartphone activities done at least once per week among users in the United States as of October 2022, by age group [Graph]. In Statista. Retrieved March 31, 2023, from https://www.statista.com/statistics/1310335/smartphone-activities-by-age-us/
Vorhaus Advisors. "Leading smartphone activities done at least once per week among users in the United States as of October 2022, by age group." Chart. November 30, 2022. Statista. Accessed March 31, 2023. https://www.statista.com/statistics/1310335/smartphone-activities-by-age-us/
Vorhaus Advisors. (2022). Leading smartphone activities done at least once per week among users in the United States as of October 2022, by age group. Statista. Statista Inc.. Accessed: March 31, 2023. https://www.statista.com/statistics/1310335/smartphone-activities-by-age-us/
Vorhaus Advisors. "Leading Smartphone Activities Done at Least Once per Week among Users in The United States as of October 2022, by Age Group." Statista, Statista Inc., 30 Nov 2022, https://www.statista.com/statistics/1310335/smartphone-activities-by-age-us/
Vorhaus Advisors, Leading smartphone activities done at least once per week among users in the United States as of October 2022, by age group Statista, https://www.statista.com/statistics/1310335/smartphone-activities-by-age-us/ (last visited March 31, 2023)
Leading smartphone activities done at least once per week among users in the United States as of October 2022, by age group [Graph], Vorhaus Advisors, November 30, 2022. [Online]. Available: https://www.statista.com/statistics/1310335/smartphone-activities-by-age-us/